The option is used to present detailed results (diagrams, tables) for the selected bars of a structure.
It is accessed by the following means.
- Select the Results > Detailed analysis layout.
- Select Results > Detailed analysis.
- Click
 .
.
Detailed analysis presents diagrams and numerical results in table form for particular bars of a structure.
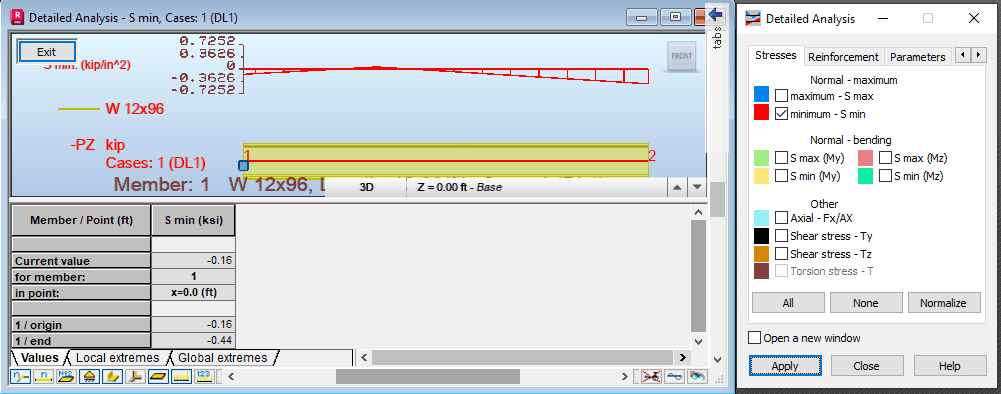
The screen is divided into three main parts.
- The Detailed analysis dialog to select the quantities to be presented and their presentation.
- The numerical calculation results presented for selected bars as a table.
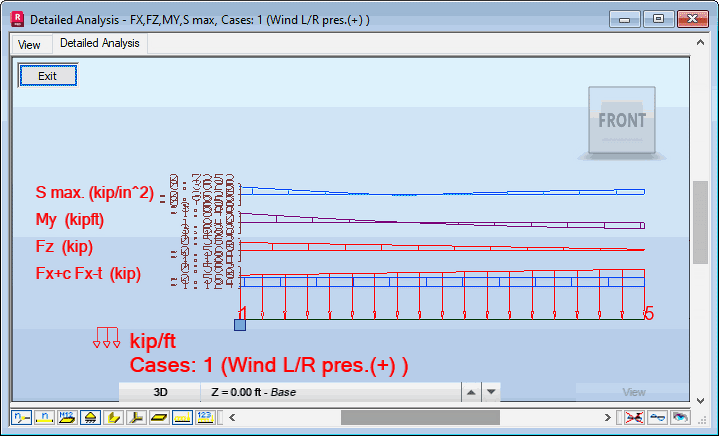
- Diagrams for the selected quantities will be presented along the relevant bars of the structure in the graphical viewer.

The table displays global displacements, values of internal forces and stresses at the beginning and end of a selected element, as well at user defined intermediate points.
The table consists of three tabs.
- Values - Presents the values in selected points of quantities.
- Local extremes - Presents local extremes of quantities for each bar subject to detailed analysis.
- Global extremes - Presents global extremes of quantities for all the bars subject to detailed analysis. If only one bar is subject to detailed analysis, local extremes are equal to global extremes.
The position of intermediate points for which the values of selected quantities are user defined. This is achieved with the Division points tab in the Detailed analysis dialog.
The graphical viewer presents detailed user defined diagrams of displacements, internal forces and stresses obtained for the active load case. The diagrams are presented along the length of relevant elements. The values of forces are presented in the sign convention. If the diagram labels are not activated, the diagrams display the points of maximum and minimum values of the quantity.

