Use the Explore Outcomes dialog to examine and compare design alternatives created using Generative Design in Revit.
For instructions, see Explore Outcomes of a Generative Design Study and Integrate a Selected Outcome.
 Video: Explore Outcomes of a
Generative Design Study
Video: Explore Outcomes of a
Generative Design Study
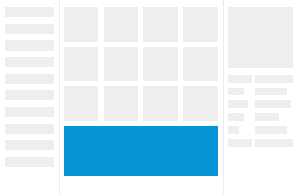
Studies list
The left pane lists studies that are completed or in progress. Check a study's progress, or select a study to explore.
Use the Filter List by Study Type option at the top of the list to filter studies by type. The filter makes it easier to find the desired study in a long list.
To hide the study list, click the
 icon. Click it again to display the list.
For each study, a summary shows the following:
- Study name and type
- Start date and time
- Completed number of outcomes/Total number of outcomes
(For the Optimize method, these numbers indicate numbers of generations rather than individual outcomes.)
- Green check mark when the study is complete
- The
 menu, which contains
Export and Delete.
menu, which contains
Export and Delete.
Hover the cursor over a study in the list to see the following:
- File size of the study
To create a new study, click Create Study. You can select the same study type or a different one, and specify a new set of design criteria.
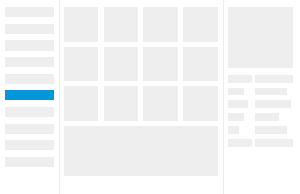
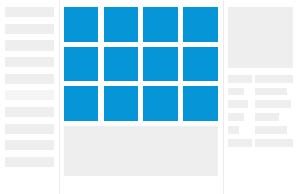
Outcomes
The middle pane displays thumbnails of the outcomes generated by the study.
Above the pane, use the controls to do the following:
- display outcomes as thumbnails or a list
- sort by a selected metric in ascending or descending order
- display the next page of thumbnails
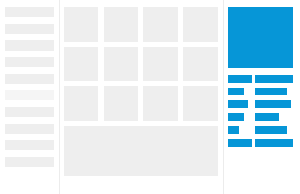
Details
The right pane displays details of the outcome that is selected in the middle pane. It shows the variables and constants used to generate the outcome, as well as the resulting outputs.
If the details pane doesn't display, select the Details option above the pane.
To see the previous and next outcomes, click the left and right arrows at the bottom of the pane.
Use Create Revit Elements to integrate the selected outcome into the model.
Charts
To display charts below the middle pane, select the Charts option above the details pane.
In the charts section, do the following:
- Click an icon to display a scatter plot or a parallel coordinates chart.
- In a chart, click a dot to see the corresponding outcome.
- In a chart, drag along an axis to filter the outcomes by that value range.
- To clear applied filters, click Clear Filters.