
Temperature Gradient Analysis
Description
This form allows positive and reverse temperature profiles to be specified by either selecting the standard type or by explicit definition. The temperature profile through a bridge deck for different types of construction is given in Article 3.12.3 of AASHTO LRFD for surfacing of up to 100mm (4IN) thickness.
Once the profiles are defined, a comprehensive series of data checks are carried out before the calculations are performed and the results displayed.
Outline Procedure
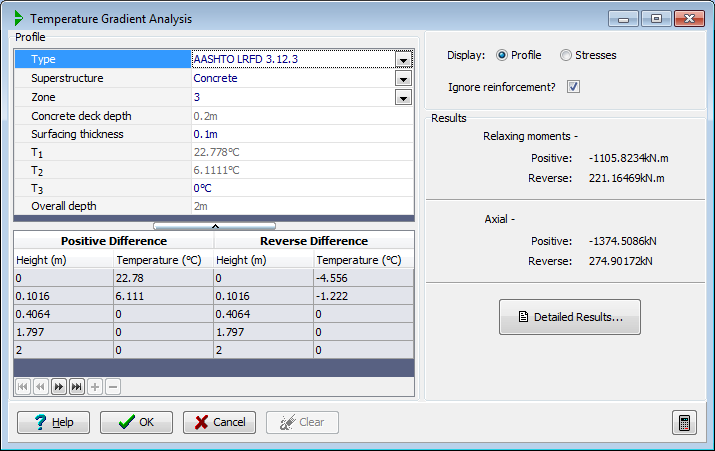
The temperature profile can be generated when the Display radio button is set to Profile by specifying only: the superstructure type and zone; the surfacing thickness; and for steel superstructures, the thickness of the concrete slab. The table shows the values generated, and the graphics show the positive and reverse temperature profiles drawn to scale. Reverse temperature profiles are -0.5 times the positive values as given in the Specifications cited above.
The table cannot be edited unless the profile type is switched to the User Defined type. With the User Defined type selected, the temperature may be specified at up to 20 heights through the section, including the top and bottom surfaces.
When the Display radio button is set to Stresses, the stress profiles are displayed graphically, and the principal values are displayed. More detailed results are available in the printout, which can be viewed by pressing the F5 key or clicking the Results button.
Note that the program calculations are based on horizontal strips. If the top or bottom surface of the section is not horizontal, the calculations will not be realistic, and a simplified model of the section may be more appropriate.
Positive temperature gradient tends to produce a negative moment and tension in a beam. Reverse temperature gradient tends to produce a positive moment and compression in a beam. The relaxing moments as reported in the results are those which need applying in the analysis to obtain the correct secondary effects.
Form Graphic
Field Help
Type
Select either the standard defined profile or the user defined profile option.
Superstructure
Click on this field to display a drop-down list labeled to select from. The shape of the temperature profile depends upon whether the superstructure is of concrete, or steel with a concrete deck. The difference is shown on Figure 3.12.3-2, and described in Article 3.12.3 of AASHTO LRFD.
The profile displayed in the graphics window will be updated in accordance with the code according to the selection made here.
Zone
The whole of the country is subdivided into various Solar Radiation Zones as shown on the map at Figure 3.12.3-1 of AASHTO LRFD. The basic Temperatures T1 and T2 vary according to the zone selected. When a zone is selected from this field, the values of T1 and T2 from Table 3.12.3-1 (ibid.) are displayed, and the temperature profile will be updated.
Alternatively, if 'other' is selected, the fields labeled T1 and T2 will become editable, and alternative non-standard values may be entered.
The temperatures displayed in Celsius correspond to the Table 3.12.3-1 Fahrenheit values minus 32 and multiplied by 5/9 (which correspond to the values shown in the AASHTO LRFD SI Units 4th edition).
Concrete deck depth
For a steel superstructure, the depth of the concrete deck needs to be specified.
Surfacing thickness
The basic temperatures T1 and T2 vary according to the surfacing thickness. For surfacing thicknesses of less than 100mm (4IN), the values are interpolated from those given in Table 3.12.3-1 of AASHTO LRFD. The program will not allow a value to be entered that is greater than 100mm (4IN). If however the surfacing thickness is greater than 100mm (4IN), alternative values for T1 and T2 may be used by setting the Zone to 'other', and entering the required values.
T3
The value of T3 is applicable only for concrete superstructures. It is generally to be taken as 0 degrees C, unless a site-specific study is made to determine an appropriate value, but it must not exceed 3 degrees C.
Positive Temperature Height/Temperature
Reverse Temperature Height/Temperature
The table cannot be edited unless the profile type is switched to the User Defined type. With the User Defined type selected, these fields allow positive and reverse temperature profiles to be explicitly specified. The temperature may be specified at up to 20 heights through the section, including the top and bottom surfaces. Values entered under the 'height' column are distances from the TOP of the section.
Any previously standard defined profile will be supplied as default values.
Note that the program calculations are based on horizontal strips. If the top or bottom surface of the section is not horizontal, the calculations will not be realistic, and a simplified model of the section may be more appropriate.
Display
Toggle between Profile and Stresses to change the graphics accordingly.
Ignore reinforcement
The temperature gradient primary stresses are calculated ignoring the presence of any reinforcement by default.
Click on this field to un-check the box so that reinforcement is included.
In all cases tendons are ignored.
If the reinforcement is included, it is allowed for only in the section properties used in the calculations, and not in the axial restraint.
Where both short term and long term values of elastic modulus are specified (i.e. for concrete properties) the short term value is used in the analysis.