
3.2 Torsion and Shear Section Properties
Subjects Covered
- Torsion Constant
- Shear Area
- Shear Centre
Outline
It is required to calculate Torsion and Shear section properties for three of the sections defined in section 2 as follows:
| Voided Slab | Calculate |
|---|---|
 |
The torsion constant for this voided slab section (taking 50% of the beam value as it is to be used in a grillage). The torsion constant as above but ignore the continuous edges. (Use a torsion grid of 20 by 20). |
| Encased Column | Calculate |
|---|---|
 |
The transformed torsion constant for this encased column (transformed to concrete units). (Use a torsion grid of 100 by 50 for the concrete and 100 by 200 for the steel column). |
| Edge Section | Calculate |
|---|---|
 |
The shear areas in both x and y direction. The shear centre coordinates (Use a grid of 100 by 100). Poissons Ratio = 0.2. |
Procedure
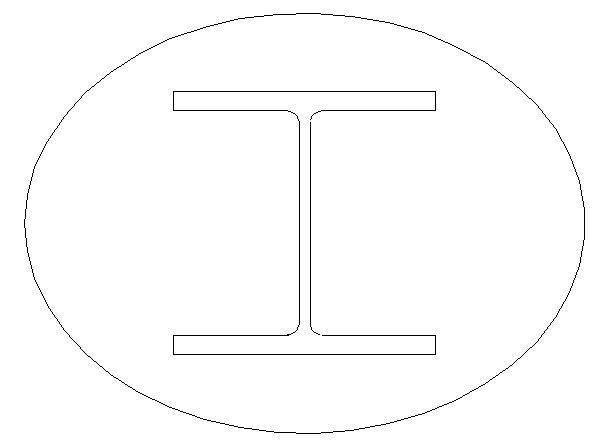
Voided Slab
Start the program and use the Home Open button to open the file “My EU Example 2_2.sam” created in example 2.2.
Use the menu item File | Titles to open the Titles form. Change the Sub-title to “Example 3.2a” and the Job Number to “3.2a”. Click on ✓ OK to close the Titles form.
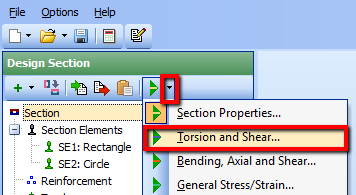
Use the Analysis toolbar button dropdown, at the top of the Design Section navigation window, and select “Torsion & Shear”.
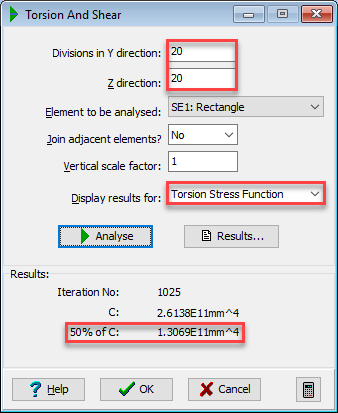
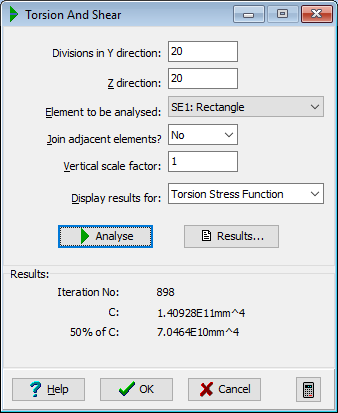
This will display the Torsion & Shear data form. Click in the Divisions in Y direction field and enter a value of “20”. Click in the Z direction field and enter a value of “20”.
Click on the Display results for drop down menu and select “Torsion Stress Function” from the list. Click on the
 Analyse button.
| Form | Result |
|---|---|
 |
 |
- Click on the Results button to display the Results Viewer. Note that 50% of C = 1.3069E11mm⁴. Close the viewer.
- Click the ✓ OK button to close the Torsion and Shear form.
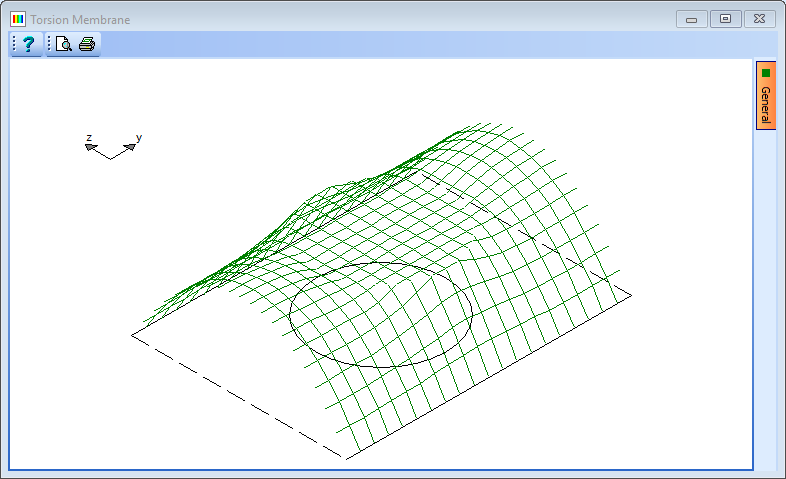
- In the Design Section navigation window select the rectangular element of the defined section, then in the graphics window click on the dotted edges of the section until they are solid lines, making this a discrete section rather than forming part of a continuous slab.
- Click ✓ OK to close the Define Section Element form.
- Use the
 toolbar button dropdown, at the top of the Design Section navigation window, to select “Torsion & Shear...”.
 - Click on the Analyse button then click on the Results button to display the Results Viewer.
Note: 50% of C = 0.70468E11mm⁴
| Form | Result |
|---|---|
 |
 |
- Click ✓ OK to close the Torsion and Shear form.
- Use the File | Save As menu to open the Save File form.
- Change the filename to “My EU Example 3_2a.sam” and click on the “Save” button to save the data file.
Elliptically Encased Steel Column
- Use the menu item File | Open to open the file “My EU Example 2_5.sam” created in example 2.5.
- Use the menu item File | Titles to change the Sub-title to “Example 3.2b” and the Job Number to “3.2b”. Click ✓ OK to close the Titles form.
- Use the toolbar button dropdown at the top of the Design Section navigation window to select “Torsion & Shear” .
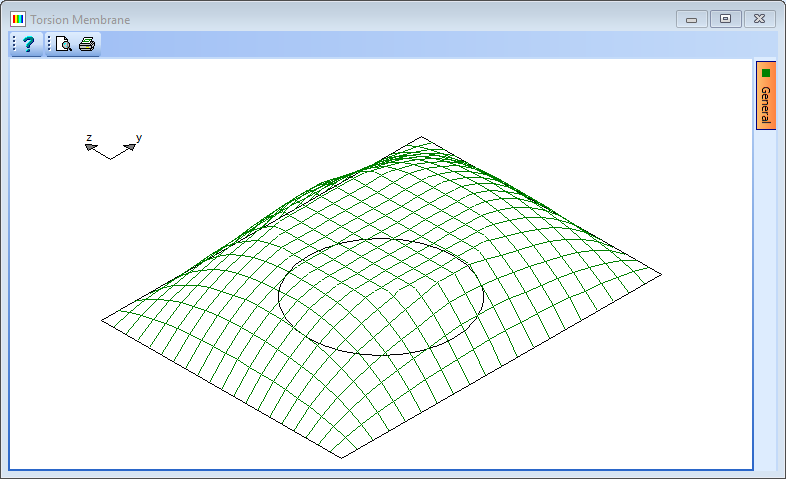
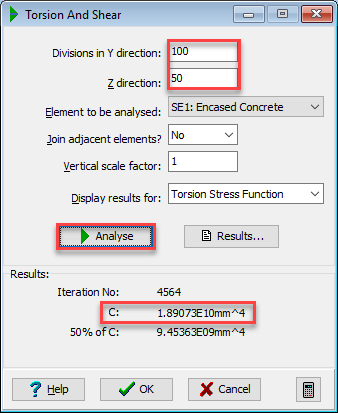
- Click in the Divisions in Y direction field and enter a value of “100”. Click in the Z direction field and enter a value of “50”.
- Click on the Analyse button in the Torsion and Shear form.
Note: the value of C in Concrete units is 1.89E10mm⁴.
| Form | Result |
|---|---|
 |
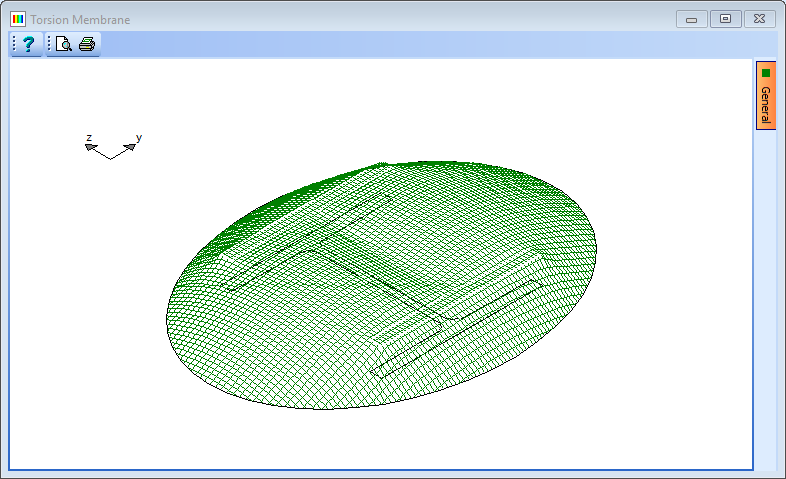 |
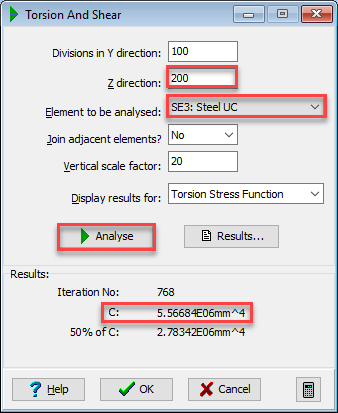
- Click in the Z direction field and enter a value of “200”. Click in the Element to be analysed field and enter a value of “3” (this is the steel column).
| Form | Result |
|---|---|
 |
 |
- Click the Analyse button.
- Therefore C of steel section in concrete units is 3.72E7.
- The combined C is the sum of the two components = 1.89E10.
- This is a lower bound value as it is assumed that in torsion, the two components are not acting compositely and warping is not constrained.
- Click ✓ OK to close the Torsion and Shear form.
- Use the File | Save As... menu to open the Save File form.
- Change the filename to “My EU Example 3_2b.sam” and click on the “Save” button to save the data file.
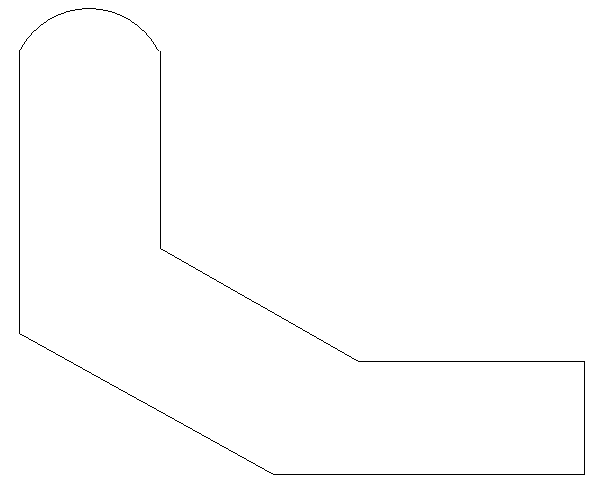
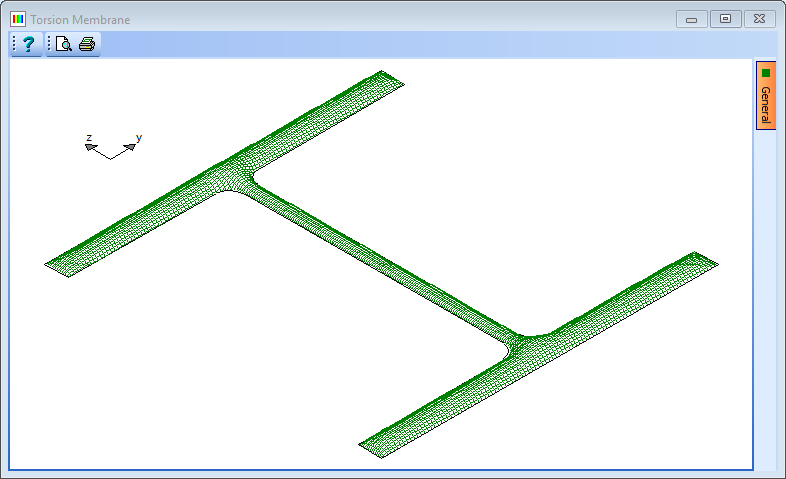
Shear Centre & Area of RC Edge Section
- Use the menu item File | Open to open the file “My EU Example 2_1.sam” created following the steps in example 2.1.
- Use the menu item File | Titles to change the Sub-title to “Example 3.2c” and the Job Number to “3.2c”. Click ✓ OK to close the Titles form.
- Use the toolbar button dropdown, at the top of the Design Section navigation window, and select “Torsion & Shear...” .
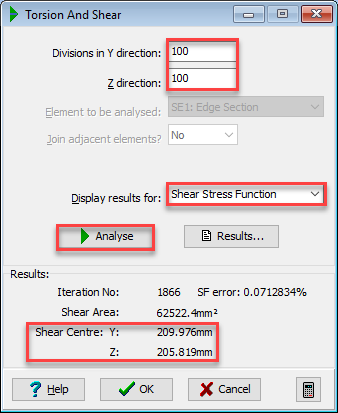
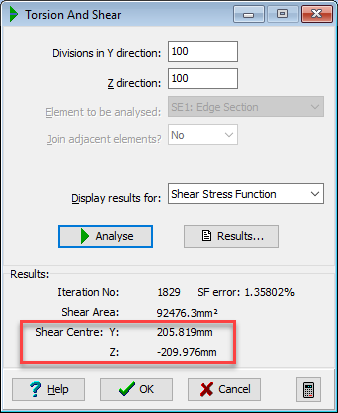
- In the Torsion and Shear form click in the Divisions in Y direction field and enter a value of “100”. Click in the Z direction field and enter a value of “100”.
- Click on the Display results for drop down menu and select “Shear Stress Function” from the list. Click the Analyse button.
| Form | Result |
|---|---|
 |
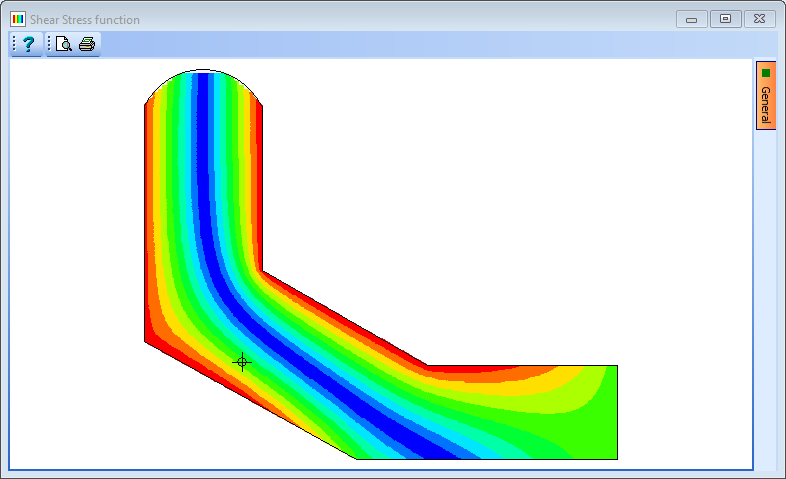 |
- The shear centre is given on the analysis form at coordinates (209, 207) and is shown by a symbol on the graphic display.
- The shear area calculated, 62522mm², is that associated with a shear force applied parallel to the z (vertical) axis.
- The shear stress distribution due to a vertical force of 1kN can be shown graphically by changing Display results for: to Shear stress ZX (for vertical shear stresses) or Shear Stress YX (for horizontal shear stresses) and clicking the Analyse button.
- Close the Torsion and Shear data form with the ✓ OK button.
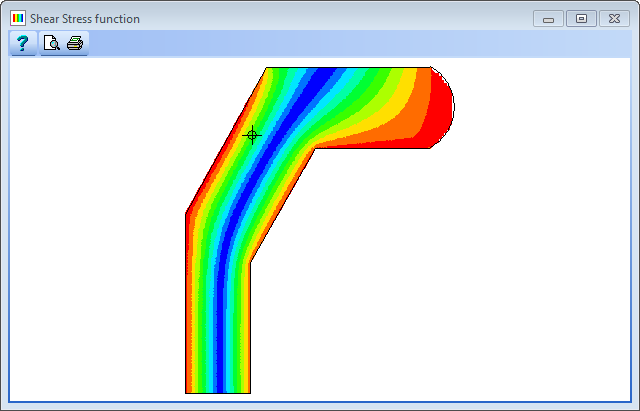
- To calculate the shear area in the Y (Horizontal) direction, the section must be rotated around by 90 degrees. This is simply done by clicking once on the 'Rotate by 90'
 toolbar button in the Design Section navigation window
 - Open up the Torsion and Shear Analysis form again, set Display results for: to “Shear Stress Function” and click on the Analyse button.
| Form | Result |
|---|---|
 |
 |
- Click ✓ OK to close the Calculate Torsion and Shear form.
- Use the File | Save As... menu to open the Save File form.
- Change the filename to “My EU Example 3_2c.sam” and click “Save” to save the data file.
- Close the program.
Summary
The first example shows the effect on the torsion constant of including the specification of continuous edges. This almost doubles the value. The 50% value would be used in a grillage analysis because the transverse members would also have a torsion stiffness so the total torsion stiffness is split between longitudinal and transverse members (hence 50%).
The second example illustrates how to deal with sections made up from multiple components having different material properties. (If they were of the same material we could have just joined them). The program cannot deal with composite sections directly in one pass but if we make a few assumptions, many sections can be analysed by considering both sections separately and using a modular ratio to combine them into one torsion constant transformed to one of the materials.
The third example illustrates how to obtain shear stress distribution in a section with the shear centre coordinates and shear areas.