Visualizing and Extracting Results from Lighting Applications
Use the extensive collection of results visualization tools to extract flow and thermal results.
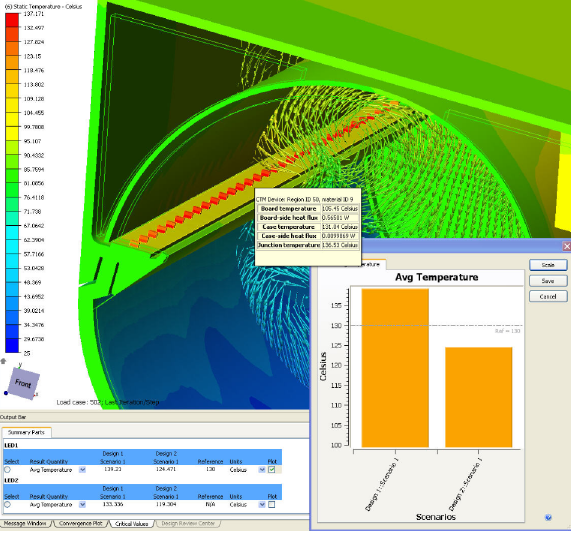
- Use Results Planes and Iso Surfaces to visualize the flow in and around the fixture.
- Use Particle traces to visualize air movement.
- Display temperature directly on parts and use Results Parts to extract quantitative temperature data.
- Use the Decision Center to compare results from multiple scenarios. Save summary images and create summary items, and evaluate the results in the Critical Values table.
For more general information, use the extensive collection of results visualization tools to extract flow and thermal results.