Use the Stress Linearization utility to graph specified stress tensors along a Stress Classification Line (SCL) that you define. The stress tensor directions are based on a local coordinate system dictated by the two endpoints of the SCL and a third point that you specify. In addition, the Stress Linearization utility determines the primary membrane stress (Pm) and primary bending stress (Pb) that comprise the total stress (Pm + Pb). The numerical process used to determine these values is documented on the page, How to Calculate Pm and Pb.
Stress Linearization is used to comply with design codes and requirements of the pressure vessel industry. However, applicability of the utility is not limited to pressure vessels. You can use the Stress Linearization utility to graph local stress tensors along a linear path and/or to determine the relative contributions of bending and membrane stress for any type of structure.
There are two different methods of determining Pm and Pb—based on the maximum shear stress, and based on the Von Mises stress. For all cases, Simulation Mechanical calculates and displays the results based on both methods.
The Stress Linearization utility is displayed in the Results environment within the
Stress Linearization
tab of the
Output Bar. To access this utility, click
Results Contours Other Results Stress Linearization.
- Stress linearization is available for brick, tetrahedral, plate, shell, and 2D elements, with or without midside nodes.
- Stress linearization is available for all linear and nonlinear analysis types that produce stress results.
- If you have the Output Bar set to auto-hide, you will not notice any apparent action when you first click the Stress Linearization command. However, expand the Output Bar, and you will see the Stress Linearization tab.
- You will not see a graph or Pm and Pb results until you have defined a valid Stress Classification Line (SCL). Appropriate warning or error messages appear within the Stress Linearization tab until the SCL is successfully defined.
The following image shows the model display area and the contents of the Stress Linearization tab of the Output Bar once the SCL is defined:
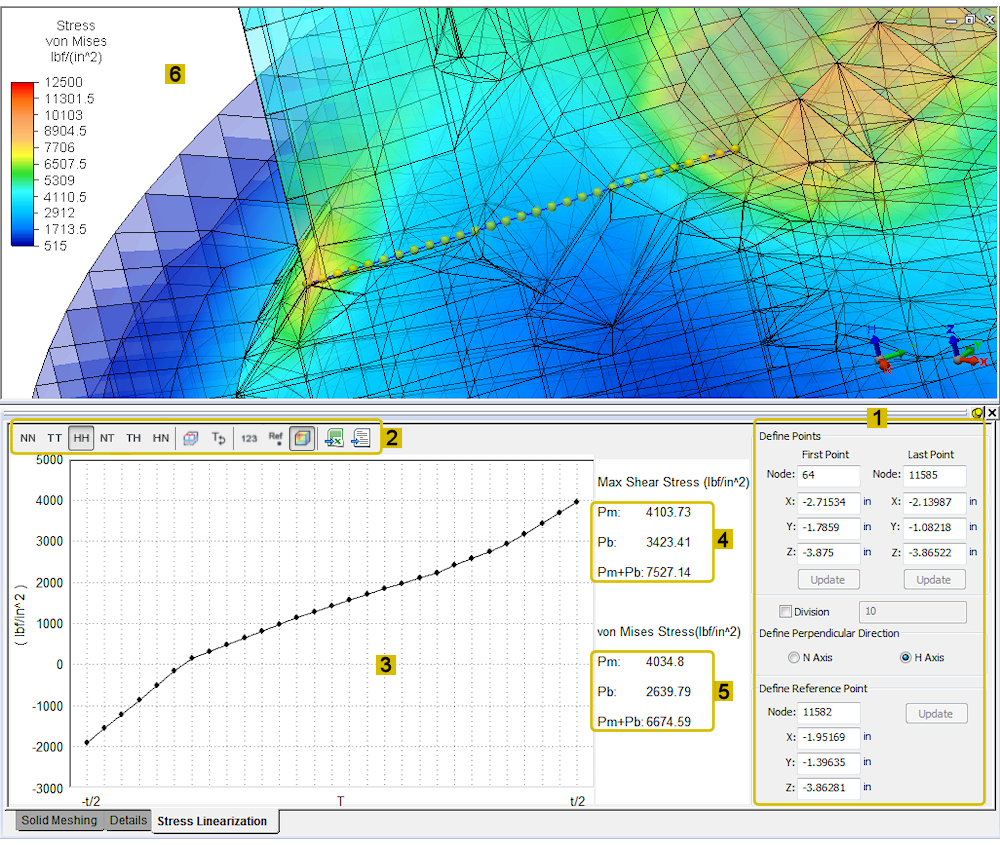
The following are the main sections of the utility, as labeled above.
- Linearization Controls: In this section, you specify the Stress Classification Line (SCL) and the coordinate system for the local stress tensor graph. For details, see the Define Points and Perpendicular Direction page.
- Toolbar: For details on the functions that can be performed by each of these buttons, see the Toolbar Definitions page.
- Graph Area: This area shows a graph of the local stress tensor results along the currently defined Stress Classification Line (SCL). This area will only be active after an SCL is defined. For details on the functions that can be performed in this area, see the Graph Area page.
- Stress Linearization Results (based on the Max. Shear Stress Method) 1
- Stress Linearization Results (based on the Von Mises Stress Method) 1
- Model Display Canvas (Results environment)
1 Note: For both calculation methods (Max. Shear Stress and von Mises Stress), the stress linearization results are as follows:
- Pm: The general primary membrane stress intensity for the current SCL.
- Pb: The primary bending stress intensity for the current SCL.
- Pm + Pb: The total primary stress for the current SCL (the sum of the primary bending and primary membrane stresses).
Pm and Pb are calculated based upon the variation of the primary stress along the SCL. For more information, see the page How to Calculate Pm and Pb.