An Iso Volume is the volume of a model that falls within a specified range of a result quantity value. Unlike an Iso Surface which shows everywhere in the model that has a single, specified value, an Iso Volume shows everywhere that falls within a range of that result value.
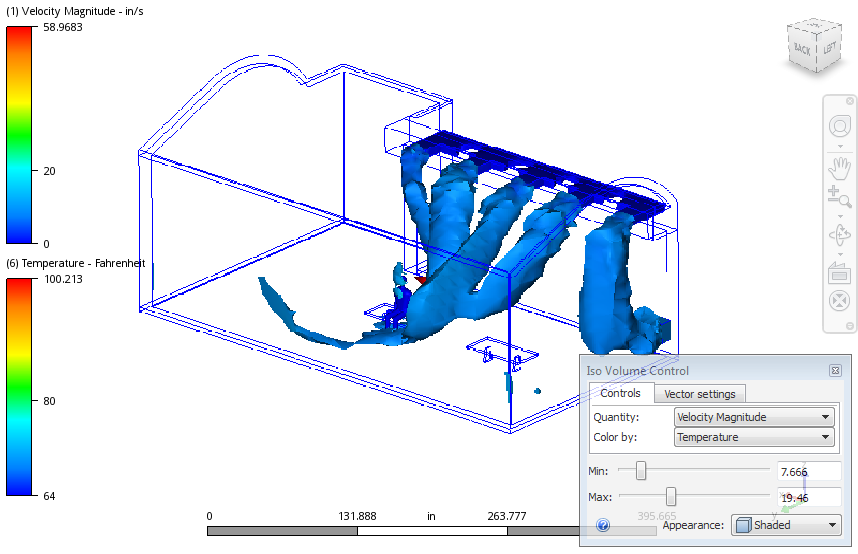
The following shows an velocity magnitude Iso Volume colored by temperature. The shape of the Iso Volume indicates everywhere in the model that falls within a specified range of velocity magnitude. The colors indicate the temperature.
Using Iso Volumes
There are multiple ways to perform most Iso Surface tasks:
- On-model: Click directly on the model or the iso volume (as indicated). This is useful for maintaining focus on the model.

- Off-model: Use the Iso Volumes branch of the Design Study bar or the Iso Volumes context panel. This is useful for complex models in which it is easier to work away from geometry.
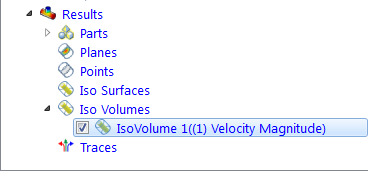
To Create an Iso Volume
Click Add on the Iso Volumes context panel.
Alternatively, right click on the Iso Volumes branch of the Design Study bar, and click Add iso volume.
To Rename an Iso Volume
Right click on the desired Iso Volume in the Design Study bar, and click Rename.
To Select an Iso Volume
- On-model: Left click directly on the Iso Volume
- Off-model: Click its name in the Design Study bar.
To Hide an Iso Volume
Uncheck the box adjacent to the Iso Volume in the Design Study bar. You can also right click on the name, and click Hide iso volume.
A hidden Iso Volume cannot be modified. Hiding one or more is often useful when capturing images
To Delete an Iso Volume
- On-model: Right click on the volume, and click Remove.
- Off-model: Right click on the desired Iso Volume in the Design Study bar, and click Remove.
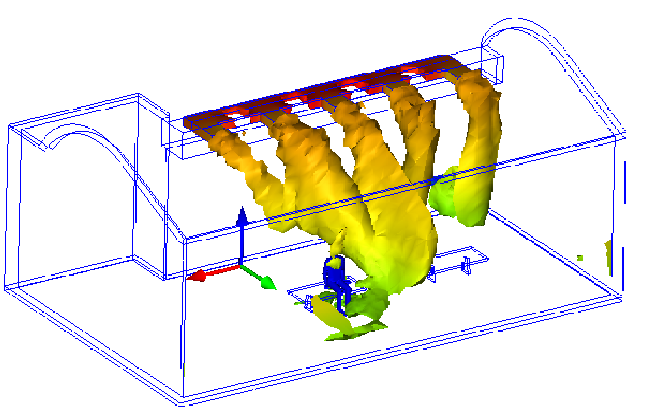
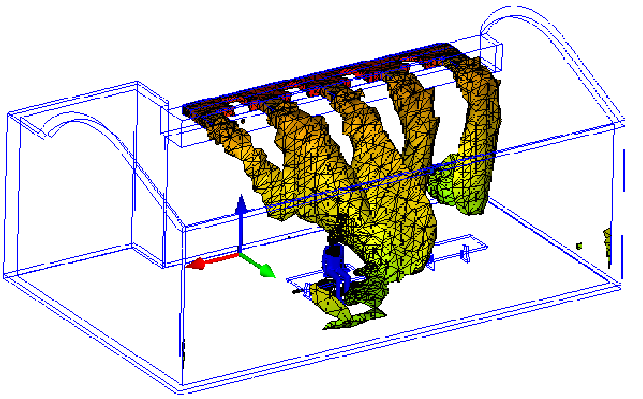
To Change the Appearance of an Iso Volume
- On-model: Right click on the Iso Volume, and select an option.
- Off-model: Click Edit from the Iso Volumes context panel, and select from the Appearance menu.
To Change the Quantity and the Color by Result Quantity
- On-model: Right click on the Iso Volume. Click Quantity or Color by result, and select from the list.
- Off-model: Select from the Quantity or Color By menus, respectively, in the Iso Volumes context panel.
The Quantity is the scalar result that determines the shape of the iso volume. The Color by Result quantity determines the color of the volume. By default, they are the same. Select different scalar results to show two results together. An example is to select temperature as the Quantity, and velocity magnitude as the Color by result. This shows the temperature at all locations in the model that fall within the specified range of velocity magnitude.
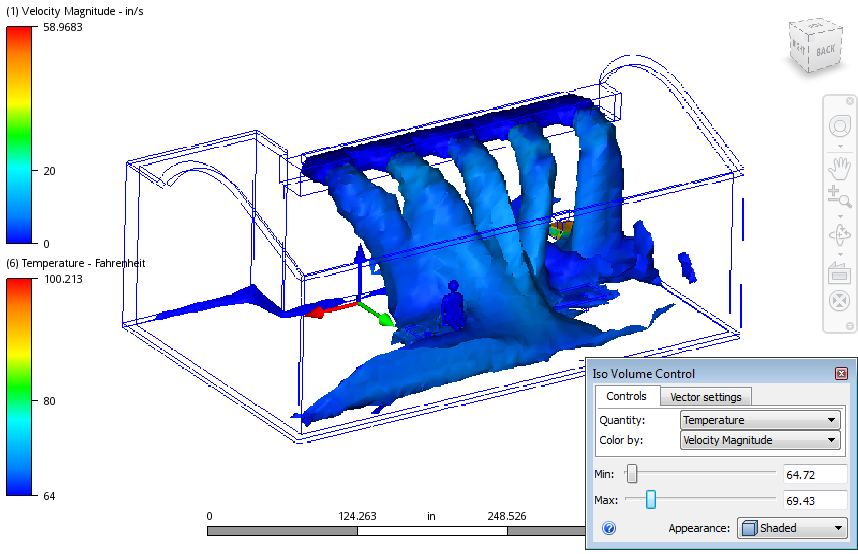
To change the range of the Quantity, drag the Min and Max sliders.
To Change Vector Appearance
- On-model: Right click on the Iso Volume. Click Vector > Vector Settings...
- Off-model: Click the arrow adjacent to Edit on the Iso Volumes context panel, and select Vector Settings.
Click More... to make the following changes:
To control the display of arrowheads
- To disable arrowheads, uncheck Show arrowheads.
- To change the size of vector arrows, specify a value for the Arrowhead size. (The default size of 1 scales the arrowhead size based on the vector length.)
- To scale all vectors by the same amount, modify the value of the Scale factor.
To show regions where the active vector is within a specified range:
- Check Filtering.
- Enter a range in the Min and Max fields.
Click Reset or uncheck Filtering to display the entire model.