Use this page of the dialogue box to review the analysis results and to apply them to the pipe network.
When you click the Analyse button in the Analyse Gravity Network dialog box, the Results page is displayed.
Visual cues and tooltips are displayed to indicate the analysis results.
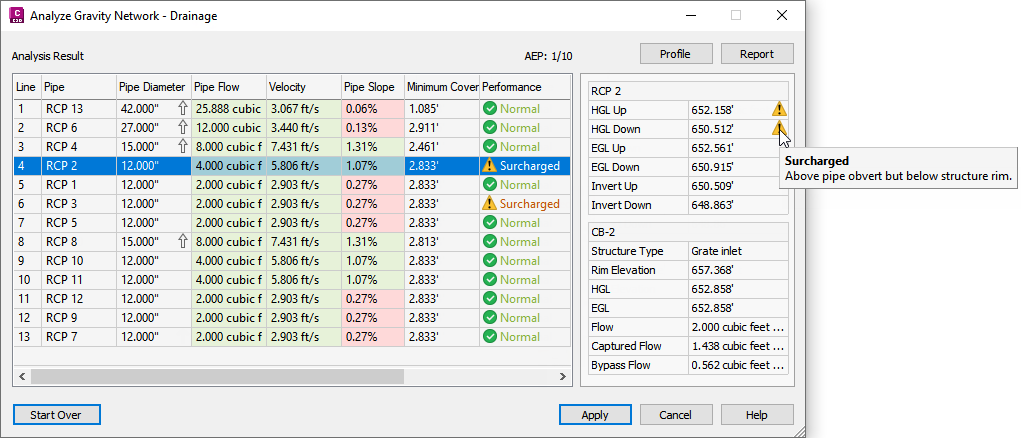
When you select a row in the results table, the right panel displays detailed information about the pipe and structure in the selected line and the corresponding line in the drawing is highlighted.
You can access commands to zoom to, pan to and select a line in the drawing by right-clicking the row and selecting a command on the context menu. Selecting the line selects both the pipe and the structure.
Analysis Results Table
- Line
- Displays each numbered line (a structure and its outlet pipe) in the pipe network.
As you select a row in the results table, the line is highlighted in the plan and profile views in the drawing and additional details are displayed on the right side of the dialogue box.
- Pipe
- Displays the pipe associated with the line.
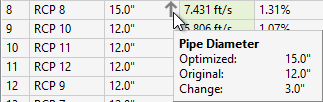
- Pipe Diameter
- Displays the pipe diameter.
If the Resize Pipes and Reset Inverts analysis type was selected on the General page, and a pipe diameter was resized, this column will contain either an up arrow or a down arrow. When you place your cursor over the arrow, a tooltip is displayed that explains how the pipe was resized.
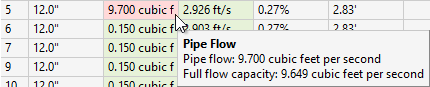
- Pipe Flow
- Displays the pipe flow value of each pipe in the pipe network.
If the pipe flow value exceeds the full flow value of the pipe, this column is shaded red. When you place your cursor over the cell, a tooltip is displayed that shows both the pipe flow value and the full flow capacity.
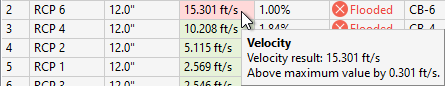
- Velocity
- Displays the velocity of the flow.
If the velocity is below the minimum velocity or above the maximum velocity specified in the Settings, this column is shaded red. When you place your cursor over the cell, a tooltip is displayed that shows the amount by which the velocity is below the minimum or above the maximum.
- Pipe Slope
- Displays the slope of the pipe.
- Minimum Cover
- Displays the minimum cover for the pipe.
This column is displayed if Resize Pipes and Reset Inverts is selected on the General page.
Note: The minimum cover value as specified on the Settings page is measured down to the (inside) crown of the pipe. It does not take into consideration the thickness of the pipe itself. If you need to account for the thickness of the pipe you can adjust the minimum cover value. The minimum cover values reported on the Results page are reported to the top of the pipe, so those reported values will be approximately equal to the minimum cover value as specified on the Settings page minus the pipe thickness. - Performance
- Displays either Normal, Surcharged, or Flooded. The analysis checks the EGL and HGL of the start and end of the pipe and of the structure and the most severe status that is determined for the line that is reported.
 Normal: The HGL is below the pipe obvert level.
 Surcharged: The HGL is above the pipe obvert level but below the structure rim.
 Flooded: The HGL and/or EGL are above the structure rim.
This column is displayed if Compute Energy and Hydraulic Grade Lines is selected on the General page.
Details about the issues are displayed on the right side of the dialogue box.
- Structure
- Displays the structure associated with the line.
- Spread
- Displays the inlet spread.
This column is displayed if Inlet Analysis is selected on the General page.
- Inlet Depth
- Displays the inlet depth.
This column is displayed if Inlet Analysis is selected on the General page.
Line Details
When you select a row in the results table, the right panel displays detailed information about the pipe and structure in the selected line. Different details are shown depending on the analysis types that are selected on the General page.
Pipe Details
- Flow
-
Displays the total amount of flow that is passing through the pipe.
This row is displayed if Resize Pipes and Reset Inverts is selected on the General page.
- HGL Up
-
Displays the HGL of the upstream end of the pipe.
This row is displayed if Compute Energy and Hydraulic Grade Lines is selected on the General page.
- HGL Down
-
Displays the HGL of the downstream end of the pipe.
This row is displayed if Compute Energy and Hydraulic Grade Lines is selected on the General page.
- EGL Up
-
Displays the EGL of the upstream end of the pipe.
This row is displayed if Compute Energy and Hydraulic Grade Lines is selected on the General page.
- EGL Down
-
Displays the EGL of the downstream end of the pipe.
This row is displayed if Compute Energy and Hydraulic Grade Lines is selected on the General page.
- Invert Up
-
Displays the invert of the upstream end of the pipe.
This row is displayed if Resize Pipes and Reset Inverts or Compute Energy and Hydraulic Grade Lines is selected on the General page.
- Invert Down
-
Displays the invert of the downstream end of the pipe.
This row is displayed if Resize Pipes and Reset Inverts or Compute Energy and Hydraulic Grade Lines is selected on the General page.
Structure Details
- Structure Type
-
Displays the structure type.
This row is displayed if Compute Energy and Hydraulic Grade Lines or Inlet Analysis is selected on the General page.
- cover Level
-
Displays the cover level of the structure.
This row is displayed if Compute Energy and Hydraulic Grade Lines or Inlet Analysis is selected on the General page.
- HGL
-
Displays the HGL of the structure.
This row is displayed if Compute Energy and Hydraulic Grade Lines is selected on the General page.
- EGL
-
Displays the EGL of the structure.
This row is displayed if Compute Energy and Hydraulic Grade Lines is selected on the General page.
- Flow
-
Displays the total amount of flow that is either captured by, or bypasses, an inlet structure.
This row is displayed if the structure is an inlet and Inlet Analysis is selected on the General page.
- Captured Flow
-
Displays the amount of flow that is captured by an inlet structure.
This row is displayed if the structure is an inlet and Inlet Analysis is selected on the General page.
- Bypass Flow
-
Displays the amount of flow that bypasses an inlet structure.
This row is displayed if the structure is an inlet and Inlet Analysis is selected on the General page.
Profile
- Displays temporary graphics in an existing profile view so you can preview the results. You are prompted to select the profile view to use if more than one profile view exists in the drawing. If a profile view doesn't exist in the drawing, you're prompted to create one first.
Note: The Analyse Gravity Network dialogue box is modeless, which means you can leave it open while you run other commands.
You can zoom and pan to an existing profile view to see a preview of the EGL, HGL and pipe changes. The colours shown in profile view are specified in the Default Settings page, which you can access from the General page of the dialog box.
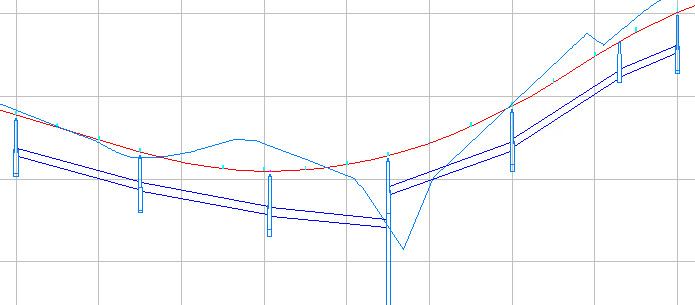
The following illustration shows the existing pipe network in profile view.
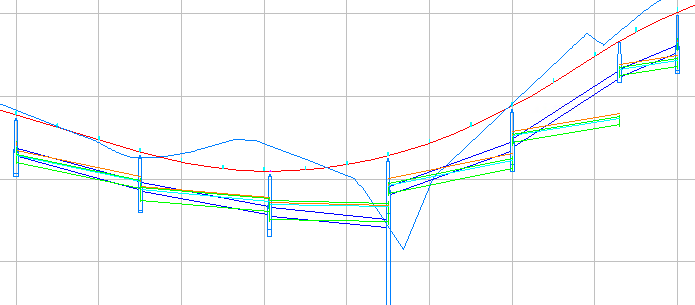
The following illustration shows how the preview graphics might appear.
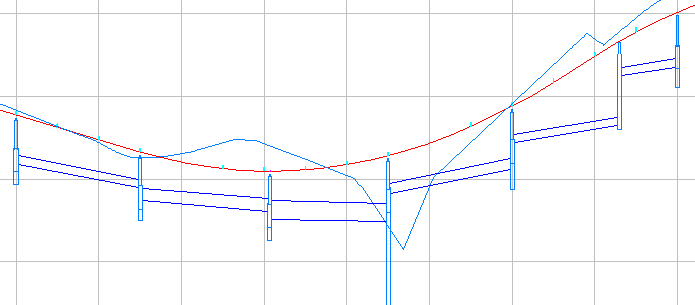
In the preview, structure depths are not adjusted because they are connected to the original pipes rather than the resized ones. However, when the results are applied to the pipe network, the structure depths are adjusted to accommodate the adjusted pipes, as shown in the following illustration.
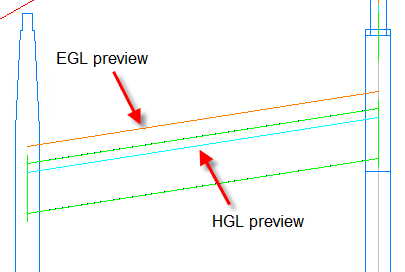
The following illustration shows a detail of the EGL and HGL lines in the preview.
Report
- Saves the results to a .csv file in a specified location.
For more information about the data included in the .csv file, see About the Gravity Network Analysis Results Report.
Apply
- Applies the calculated results to the pipe network.
- If you selected Resize Pipes and Reset Inverts, applying the results updates the pipe sizes and invert levels according to the calculated results, and will apply all of the calculated properties to the pipe network.
Note: Applying the results to the pipe network does not apply energy and hydraulic grade values unless the Compute Energy and Hydraulic Grade Lines option was also selected on the General page.
- If you selected Compute Energy and Hydraulic Grade Lines, applying the results will apply the calculated energy and hydraulic grade values to the affected parts in the pipe network.
- If you selected Resize Pipes and Reset Inverts, applying the results updates the pipe sizes and invert levels according to the calculated results, and will apply all of the calculated properties to the pipe network.