Select these options from the menu.

- Animation Details
-
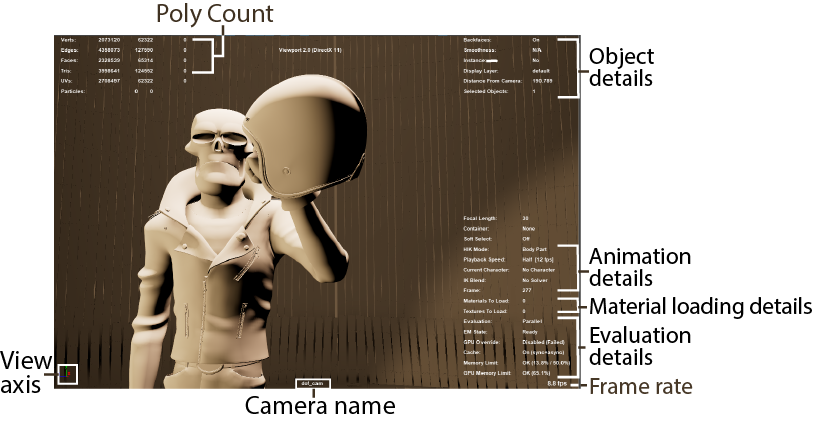
Turns on or off the display of a list of animation details, which include: Playback Speed, Current Character, and IK Blend. The details are displayed above the Frame Rate in the bottom-right corner of the panel. The default is off.
- Cache
-
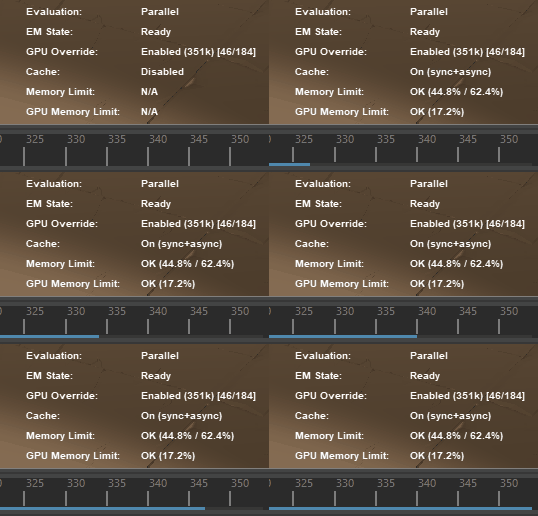
Displays the state of playback caching and memory usage details.Note: You can turn on this option from the Evaluation Toolkit .See Caching in the Evaluation Toolkit topic and Use Cached Playback to increase playback speed.
- Camera Names
-
Displays the camera name (such as persp, top, side, front) in the bottom-center of the view panel. The default is on.
- Caps Lock
-
Displays an in-view message when Caps Lock is on. The default is on.
- Current Asset
- When set, any subsequent nodes you create are automatically added to that asset.
- Current Frame
-
Displays the current playback frame number in the bottom-right corner. The default is off.
- Evaluation
-
 Indicates the current Evaluation mode. See Evaluation in Preferences > Animation to change evaluation nodes.
- If you are in DG mode, Evaluation: DG displays. The EM State shows Off, and the GPU Override shows N/A.
- If you are in
Serial or
Parallel mode,
Evaluation: Serial or
Evaluation: Parallel displays, along with the EM State.
EM State indicates whether the Evaluation Manager has an up-to-date evaluation graph, or if it needs to re-build the graph the next time evaluation is triggered by a playback. For example, when something in the DG changes, such as the deletion of a node connection, the Evaluation Manager is no longer in sync with the DG, so the Heads Up Display shows Rebuild required.
When an evaluation is triggered, the Evaluation Manager rebuilds the EM graph and the HUD shows Built, followed by Ready.
- If the
GPU Override option is active, which only occurs when you use Serial or Parallel mode,
GPU Override displays, which counts the number of mesh vertices (in thousands) being evaluated by the GPU, instead of the CPU. For example, if the HUD shows
GPU Override: Enabled (94k), this indicates that 94,000 vertices are being evaluated by the GPU. Next to the vertex count, the number of nodes in the deformerEvaluator are on the GPU is displayed in square brackets. For example, [46/184] indicates that 46 out of the 184 nodes in the deformerEvaluator are on the GPU.
Note: The GPU Override HUD setting does not display vertices from animated topology. For example, if a Cluster deformer was used to animate a sphere, the GPU does not partition it.
- Focal Length
-
Displays the focal length of the current camera in the bottom-right corner. The default is off.
- Game Vertex Count
-
Displays the number of vertices that will be evaluated by a real-time game engine (Unreal or Unity). To see this option, you must load the gameVertexCount plug-in.
- In
Unreal mode:
- Tangent Mode
- Configures the method that Unreal evaluator uses to compute vertex tangents:
- None: Imports no tangents. This will not work with normal-mapped shaders.
- Maya: Uses Maya's built-in normal generation method.
- MikkT: Uses the MikkTSpace normal generation method in Unreal's FBX mesh import.
- In
Unity mode:
- Weld Vertices
- Merge overlapping vertices that share the same properties overall (including UVs, normals, tangents, and vertex color).
- Normals
- Configures how normals are calculated:
- Import: Imports normals from FBX files. If the file contains no normals, they will be calculated.
- Calculate: Calculate the normals based on the following factors.
Note: This setting is best for very smooth, organic or high-poly models. Since Unity bases hard edges on a single angle, this option may smooth over some parts of the model by mistake. It's generally preferable to smooth your model manually and then use the Import setting above
- Normals mode
- Configures how Unity calculates normals:
- Unweighted (Legacy): Uses a legacy (pre-2017.1) method to calculate normals.
- Unweighted: Normals are not weighted.
- Area weighted: Normals are weighted by face area.
- Angle weighted: Normals are weighted by vertex angle per face.
- Area and Angle weighted: Normals are weighted by both face area and vertex angle per face.
- Smoothness source
- Configures how Unity smooths edges:
- Prefer Smoothing Groups: Use smoothing groups from the import file (where applicable)
- From Smoothing Groups: use smoothing groups from import file only.
- From Angle: Use smoothing angle to determine edge smoothness.
- None: Don't split vertices at hard edges.
- Smoothing Angle
- Control how vertices are split for hard edges. Higher values result in fewer faces.
- None: Import no normals.
- Tangents
- Configures the method Unity evaluator uses to compute vertex tangents:
- Import: Imports vertex tangents from FBX files.
- Legacy: Uses Unity's legacy normal generation algorithm.
- None: Imports no tangents. This will not work with normal-mapped shaders.
- MikkT: Uses Mikktspace normal generation method in Unity's FBX mesh import.
- In
Unreal mode:
- Frame Rate
-
Displays the frame rate in frames per second (FPS) for the current view in the bottom-right corner of the Viewport. The default is off.
The Frame Rate displayed is the refresh frame rate. The refresh frame rate represents the time between successive refreshes of the 3D viewport. The refresh frame rate updates if you are playing back or manipulating objects in Maya.
The playback frame rate is influenced by your Real-Time vs Play Every Frame settings. The graphics card vsync setting (which synchronizes the Viewport display with the monitor refresh rate and can be a reason why the frame rate may decrease if the number of Viewports increases).
- HIK Details
-
Displays the current HumanIK Keying Mode for your scene in the bottom-right corner. The default is off.
- Material Loading Details
-
Displays the progress of material and texture loading. This information is most useful if used with the Deferred and Parallel Material Loading Modes in the Preferences window, Display category. See Display preferences for more information.
The Materials To Load and Textures To Load fields in the HUD indicate 0 when material realization is complete and textures have completed loading.
- Object Details
-
Displays a list of object details that includes: Backfaces, Smoothness, Instance, Display Layer, Distance From Camera and number of Selected Objects. The details are displayed in the top-right corner of the panel. The default is off.
- Origin Axis
-
Displays the global axis at the origin (0, 0, 0) within the perspective view. The default is off.
- Particle Count
-
Displays the total number of particles and the number of selected nParticles in the scene. Particle Count includes the number of nParticles and classic particles in the scene.
- Poly Count
-
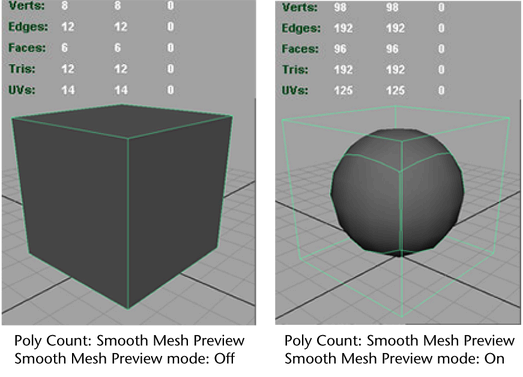
Displays polygon statistics for the visible objects displayed in the view panel, including Vertices, Edges, Faces, Triangles, and UVs. This feature is useful for games development. The first column on the left lists the total components of all the polygons in the scene. The second column lists the total components of the selected polygon(s). The third column lists the total selected components. The default is off.
Note:In Viewport 2.0, the Poly Count includes all objects in the scene, including those that are off screen. On the other hand, the Poly Count displayed in the Legacy Default Viewport only includes the objects seen by the camera.
Poly Count >
 has two options.
- Cage
-
Displays the polygon statistics of the cages (the original meshes) for the visible objects in the panel.
- Smooth Mesh Preview
-
Displays the polygon statistics for the visible objects displayed in the panel.
When the display is set to default mode, the cage statistics are shown.
When the display is set to Smooth Mesh Preview mode, the statistics for the smoothed objects are shown.

- Scene Timecode
-
Displays the scene timecode in the bottom-right corner of the scene view. Default is off. See also Set and display timecode for the scene.
- Select Details
-
Displays the current state of Soft Selection in the bottom-right corner of the scene view.
- Symmetry
-
Displays the current axis of symmetry in the top-middle of the scene view if Symmetry is active. The default is on.
- View Axis
-
Displays the global axis in the bottom-left corner of all views. The default is on.
- Viewcube
- Displays the Viewcube in the upper right corner of the Viewport. See Viewcube Preferences.
- Viewport Renderer
-
Displays the viewport type and rendering engine in the top-center of the viewport. The default is off.
- In-view Messages
-
Shows or hides the messages that appear for certain tools, modes, and operations. The default is on. See also Help preferences.
- XGen Info
- Displays the number of XGen Splines and the amount of GPU Memory used.
- In-View Messages
- Shows or hides In-view Messages.
- In-View Editors
- Shows or hides the In-Vew Editor that appears after performing a number of different modeling operations. The default is on. See In-View Editor.