
2D Simulation results can be displayed:
- As themes on the GeoPlan and the 3D Network windows
- On a Long Section window
- On a Section window
- In Time Varying Results grid and graphs
- On graph reports
- On the 2D Zone Mesh Element Properties dialog
2D results can also be exported to CSV file and are included when exporting results to GIS.
2D themes
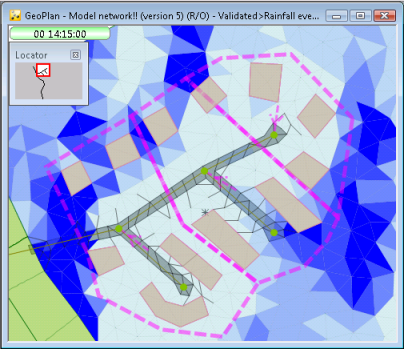
Depth, velocity and direction of flow in 2D mesh elements can be displayed as themes:
- Right click on the GeoPlan window and select Properties & Themes from the popup menu.
- Set up themes to display 2D results:
- 2D Triangles theme: display the value of depth, direction or velocity of flow in mesh elements using the colour, line type and fill type of the element.
- Flood theme: display values of depth as a contoured theme.
- 2D Arrows theme: display the direction and velocity of flow in mesh elements using arrows of varying lengths.
2D results on pick grids and graphs
The pick grid and graph tools can be used to display time varying data for a single mesh element or a Results analysis object as outlined in the following sections.
Results grid
To display a grid showing time varying data for a single mesh element or a 2D Results analysis object:
- Open simulation results in the GeoPlan View.
- Click on the grid tool button
 on the
Results toolbar.
on the
Results toolbar.
- Click on one of the following objects on the GeoPlan:
- 2D Zone mesh element
- Network results object (point, line or polygon) for InfoWorks networks
- 2D Results analysis object
A Time Varying Results Grid of 2D results will be displayed.
Results graph
To display a graph of time varying data for a single mesh element or a Results analysis object:
- Open simulation results in the GeoPlan View.
- Click on the graph tool button
 on the
Results toolbar.
on the
Results toolbar.
- Click on one of the following objects on the GeoPlan to display a selection dialog:
- 2D Zone mesh element
- Network results object (point, line or polygon) for InfoWorks networks
- Results analysis object
- Select parameters to be graphed (up to two parameters can be plotted on a single graph).
- Click OK.
A Graph View of the selected 2D results will be displayed.
2D results on graph reports
Results for Results analysis objects can be graphed on the following graph reports:
And on the following custom graph reports:
- Flexible
- Extreme Value Analysis
2D results on the Mesh Element Properties dialog
2D element results can be viewed on the 2D Zone Mesh Element Properties dialog.
To display summary results for a single mesh element
- Open simulation results in the GeoPlan View.
- Click on the information tool
 on the
GeoPlan Tools toolbar.
on the
GeoPlan Tools toolbar.
The 2D Polygon Mesh Element Properties dialog will be displayed with a grid of results for the 2D element.