The IDF curve (Intensity-Duration-Frequency curve) defines rainfall intensity as a function of:
- storm duration
- return period
Each return period represents a statistical rainfall frequency (for example, 2-year, 5-year, or 10-year events).
In Network design, the IDF curve is used to determine rainfall intensity for peak flow calculation when the Rational method is selected in the Peak flow calculation method setting of the Design constraints object.
The IDF curve provides rainfall intensity values for a range of storm durations. These values are typically derived from long-term rainfall records and represent statistical design rainfall conditions used for hydraulic design.
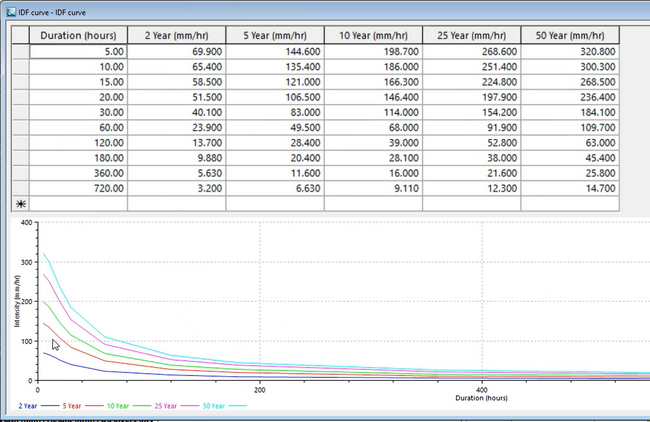
Sample IDF Curve
Return period selection
The selected return period determines which intensity-duration relationship is applied during design.
Rainfall intensity is selected from the IDF curve using:
- the calculated time of concentration
- the IDF curve return period specified in the Network design dialog
The return period, specified in years, represents the statistical recurrence interval of the rainfall event used for design. For example, a return period may be 2, 10, or 100 years.
When adding a return period to an IDF curve, enter a positive value greater than 0. Return periods can be specified to one decimal place.
For each duration and return period (years) in the IDF table, a rainfall intensity value (mm/hr) is defined. Only the selected return period is used during the peak flow calculation.
Time of concentration
The time of concentration (Tc) is used to determine rainfall intensity from the selected IDF curve during the Network design process.
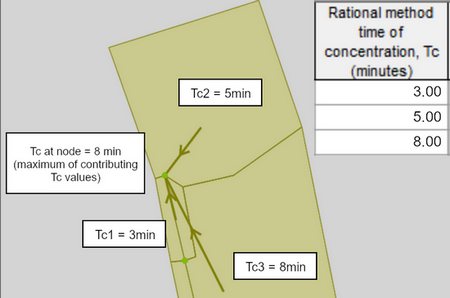
For a node located at the upstream end of a branch, Tc is taken from the contributing catchment and represents the travel time from the most hydraulically remote point in the catchment to the node inflow. The subcatchment Tc can be specified directly using the new Rational method time of concentration, Tc (minutes) parameter.
If multiple subcatchments are connected to the same node, the maximum Tc value will be used. In the example below, we have 3 subcatchments connected to the upstream node of a network and in this case, the time of concentration that will be used in the design is Tc = 8min.
Moving downstream through the network, Tc is increased by the travel time through each pipe segment. Travel time is calculated as:
|
Travel time = pipe length / flow velocity |
For pipes within the design region, the velocity used in this calculation is the design velocity calculated for the pipe during candidate evaluation.
For upstream pipes located outside the design region, where design details are not available, velocity is estimated assuming 50% full pipe flow.
For hydraulic structures such as pumps, orifices or weirs, travel time is assumed to be zero.
At junctions where multiple upstream branches meet, the downstream Tc is set to the largest travel time among the contributing upstream branches.
If the calculated time of concentration (Tc) is less than the Global minimum time of entry, the minimum value is used when selecting rainfall intensity from the IDF curve. The calculated Tc is retained for downstream calculations.
For example, if Tc is calculated as 3 minutes and the global minimum is 5 minutes, the 5-minute value is used to select rainfall intensity for design. However, the 3-minute value is used to accumulate travel time and determine Tc at downstream nodes.
Peak flow calculation (Rational Method)
During design, rainfall intensity corresponding to the calculated time of concentration is obtained from the selected IDF curve and used in the peak flow calculation.
Where the Rational Method is used:
| Q = K · C · I · A |
Where:
- Q = peak flow
- K = unit conversion constant
- C = runoff coefficient (taken from the subcatchment - new attribute; where multiple catchments contribute, C is calculated as an area-weighted value)
- I = rainfall intensity corresponding to Tc
- A = contributing area (accumulated downstream as flows from upstream catchments combine)
The IDF curve provides the value of the rainfall intensity I (mm/hr) used in the peak flow calculation.
Because the Rational Method assumes steady peak flow conditions, it should be used to ensure that the pipes are designed to satisfy the required design level for conveyance. Storage, control structures and real time controls are not represented or accounted for in the design stage. For this reason, the designed network from the Network design tool should be validated using dynamic hydraulic simulation.
Use in Network design
Within the Network design tool, the selected IDF curve is used only for peak flow calculation when the Rational method is selected.
It does not affect:
- geometric constraints (slope, cover depth, velocity)
- Pipe network catalog limits
Changing the return period affects:
- the rainfall intensity selected
- the resulting peak flow
- the required hydraulic capacity
- the set of feasible pipe sizes