Wind Tunnel Settings specify the type of wind tunnel analysis and how the airflow data and conceptual models are displayed.
Head-Up Controls
Use the Head-Up Controls to enable the interactive 3D grid controls and the compass slider. When this is enabled, click the compass slider to adjust the manual air velocity and the wind direction (angle) controls. When you adjust the compass arrow and the velocity slider, the Velocity and Angle values In the Real-Time Analysis drop-down dynamically update.
View Navigation
| View Navigation Options |
|---|
 Select. Enables the interactive grid controls. Select. Enables the interactive grid controls. |
 Pan. Click Pan and click and drag your pointing device to move the model in the same direction. Pan. Click Pan and click and drag your pointing device to move the model in the same direction. |
 Rotate. Click Rotate and click and drag your pointing device . Rotate. Click Rotate and click and drag your pointing device . |
 Zoom. If you click the Zoom tool and hold down the button on your pointing device, you can adjust the magnification of the model by dragging up and down. Or you can click Zoom and use your mouse wheel. Zoom. If you click the Zoom tool and hold down the button on your pointing device, you can adjust the magnification of the model by dragging up and down. Or you can click Zoom and use your mouse wheel. |
 Adjust Perspective. Adjust Perspective. |
 Perspective view. Orients the view to a perspective view which portrays height, width, and depth. Perspective view. Orients the view to a perspective view which portrays height, width, and depth. |
 Orthographic view. Orthographic 3D views show the building model in a 3D view where all components are the same. Orthographic view. Orthographic 3D views show the building model in a 3D view where all components are the same. |
 Plan view. Orients the view to a plan view. Plan view. Orients the view to a plan view. |
 Front view. Orients the view to the east-facing front. Front view. Orients the view to the east-facing front. |
 Side view. Orients the view to the south-facing side. Side view. Orients the view to the south-facing side. |
 Fit to view. Expands or resizes the model to fit the view window. Fit to view. Expands or resizes the model to fit the view window. |
Real-Time Analysis Tab
Begin Airflow Simulation: Click Play/Pause to start or pause the simulation. When you first open this feature, the 2D data slice simulation starts by default.
Analysis: Selects the calculation type, either a 2D or 3D analysis. Specifies whether to run an analysis on the 2D data slice or a full 3D analysis of the entire space. A 2D slice analysis refers only to the area around the slice. Select 3D to account for flows moving horizontally and vertically around obstructions.
Velocity (m/s): Specifies the relative wind velocity. Use the slider bar or enter a numeric value.
Angle: Specifies the relative wind direction. Use the slider bar or enter a numeric value.
Display: Specifies the type of analysis data to display, either Wind Velocity (m/s) or Air Pressure (Pa).
Detailed Wind Analysis: Opens the Wind Rose dialog.
Analysis Grid Settings: Use these settings to specify the 3D analysis grid size and extents. After making changes, click Apply and then OK. See Ecotect Wind Tunnel Overview for information about setting the size of the calculation grid.
2D Grid Slice Tab
Show 2D Data Slice: Displays a 2D slice through the grid data.
Position: Specifies the relative slice position. Use the slider bar or enter a numeric value.
3D Axis: Specifies the planar axis of the slice.
Display: Specifies how the data is graphically displayed.
Show Grid Lines: Specifies whether to display 3D displacement grid lines.
Displace Values in 3D: Enables the display of data as a 3D displacement map. For Amount, specify the 3D displacement in grid values. Use the slider bar or enter a numeric value.
3D Volumetric Tab
Show 3D Volumetric: Displays 3D volume data graphically.
Threshold: Adjusts the range of values for the 3D display.
Display: Select an volumetric data type to use for displaying the results of the analysis.
Flow Line Settings: Specifies the settings of generated 3D flow lines. You can specify the boundary to flow from, boundary heights and offset values, flow characteristics and arrow display shape.
Data Display
Metrics: Specifies the data to analyze. Specify air flow or air pressure.
Minimum: Specifies the data range minimum.
Maximum: Specifies the data range maximum.
Colors: Specifies the color scale used to display the data range.
Opacity: Adjusts the color scale opacity.
Model Display
Element Outlines: Displays boundary outlines.
Element Surfaces: Displays filled surfaces. Turn off to display wireframes.
Ground Plane Grid: Displays the ground plane (Z=0) with a simple grid.
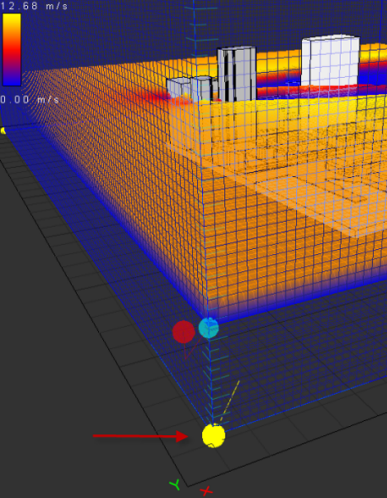
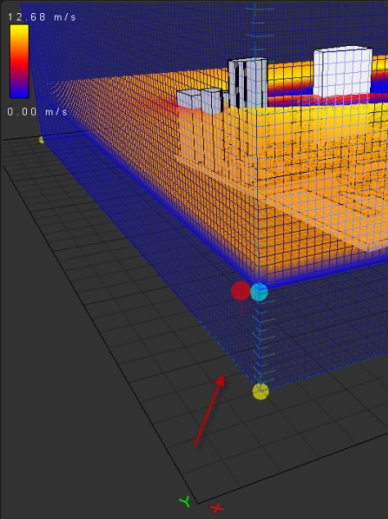
3D Analysis Grid: Displays an outline of the full 3D analysis grid and displays grid controls on the corners of the grid axis.
 |
 |
- Wind Frequency Chart: Displays the overlay data if the compass slider is inactive. This is enabled by default.
- Wind Rose: Displays the wind values as a wind rose. The Ecotect Wind Rose Chart is disabled if Local Wind Data is turned off. This is disabled by default.
Perspective Projection: Enables a perspective view of the model.
Use Advanced Lighting: Enables advanced lighting effects in the view.