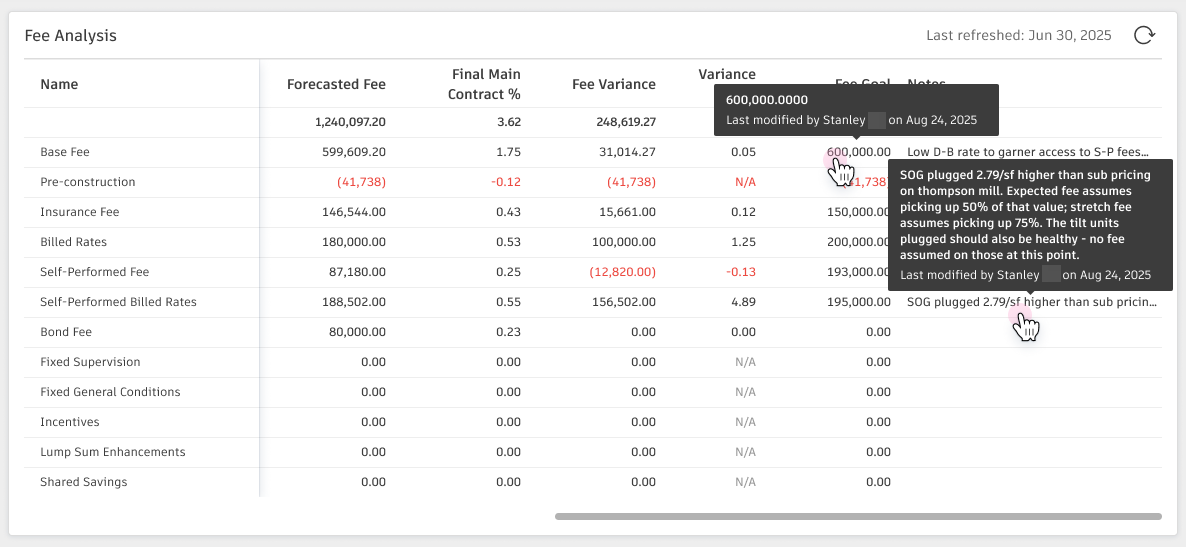
Fee Analysis
Fee Analysis helps project teams compare original and forecasted fees against the main contract amount, so you can see how project fees are tracking and where variance is coming from. Fee Analysis is configured in project settings and viewed in the Budget view's Analysis panel (renamed from Charts).
In this article:
- Fee Analysis Workflow
- Fee Analysis Calculations
- Where to Find Fee Analysis
- Permissions
- Edit Fee Goal and Notes
- Related Articles
Fee Analysis Workflow
To use Fee Analysis on a project:
- Set up fee categories and the Final Main Contract Amount Source in project settings — see Fee Analysis settings. If a budget column you need doesn't exist, add it as a custom column in the Fee Analysis column group first.
- (Optional) Apply a Budget Financial Markup Formula to the Final Main Contract Amount column to drive markup-based values — see Apply Markup Formula on Budget Columns.
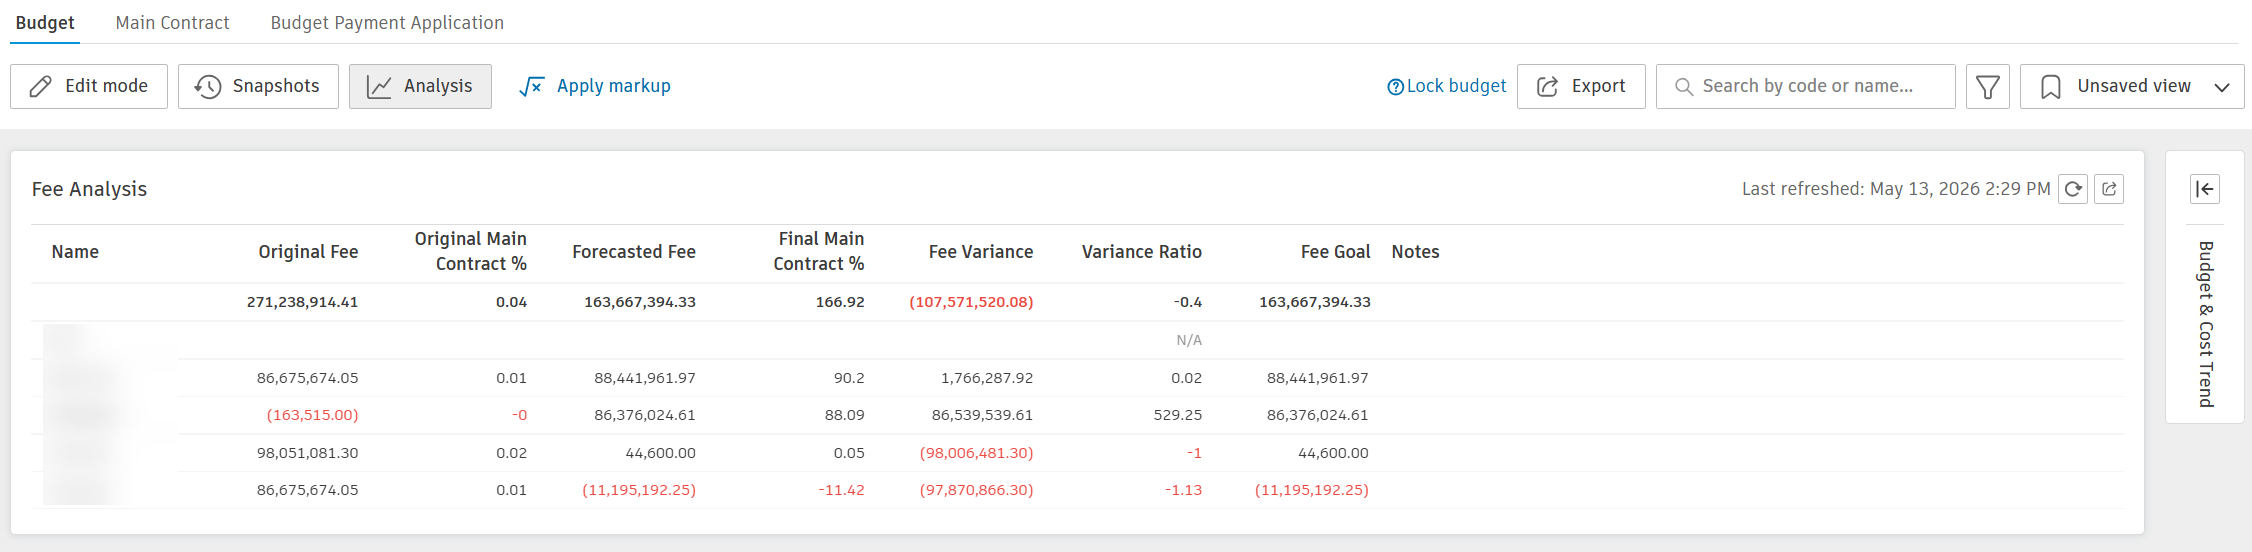
- Open the Analysis panel from the toolbar in the Budget tool to view the Fee Analysis table.
- Review variance per category. Compare Original Fee vs. Forecasted Fee, Fee Variance, and Variance Ratio. Use View budget column in a value's tooltip to inspect a fee's source.
- Set Fee Goal and Notes on each row to record targets and context.
- Refresh the Fee Analysis card whenever source budget data changes — values are not auto-refreshed.
- (Optional) Take a Fee Analysis Snapshot to capture and compare Fee Analysis states over time — see Fee Analysis Snapshot.
Check out the overview video to see the fee analysis workflow in action:
Fee Analysis Calculations
For each fee category, the Fee Analysis table shows:
- Original Fee — The total of the budget column you selected for the original fee.
- Original Main Contract % — Original Fee ÷ Total Main Contract Amount.
- Forecasted Fee — The total of the budget column you selected for the forecasted fee.
- Final Main Contract % — Forecasted Fee ÷ Total Final Main Contract Amount.
- Fee Variance — Forecasted Fee − Original Fee.
- Variance Ratio — Fee Variance ÷ absolute value of Original Fee.
- Fee Goal — Defaults to Forecasted Fee; can be manually overwritten.
- Notes — Free text for context.
Where to Find Fee Analysis
Open the Analysis panel from the toolbar in the Budget tool (this button was previously labelled Charts). The panel shows the Budget & Cost Trend chart and the Fee Analysis table.
To investigate where a fee number comes from, click any value in Original Fee or Forecasted Fee and choose View budget column in the tooltip. The Budget table scrolls to the source column and highlights it briefly.
Permissions
| Action | Required permission |
|---|---|
| View | View All or Full Control to budget view |
| Refresh values | Full Control to budget view |
| Edit Fee Goal or Notes | Full Control to budget view |
| Configure fee categories | Project administrator (Admin permission) |
Edit Fee Goal and Notes
- Fee Goal — Numeric, defaults to Forecasted Fee. Cannot be empty; clearing reverts to Forecasted Fee. Enter
0to set zero explicitly. - Notes — Plain text, up to 2,048 characters.