Activity 8: Explore outcomes using a table
In this activity, you use the Table View to sort outcomes, open an outcome in the Outcome View, and compare multiple outcomes.
Prerequisites
- The previous activity has been completed.
- All outcomes, including those selected for comparison, are shown in the Scatter Plot View.
Steps
Set the Volume range to 9.000 and sort by volume in the Table View.
- On the Explore tab, click Display > Table View
 .
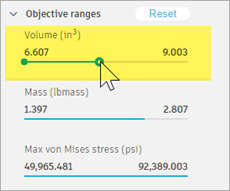
. - To show only outcomes in the new range, on the left, in the Outcome Filters area, under Objective Ranges, on the Volume (in^3) slider, drag the right endpoint to 9.000, or as close to 9.000 as possible.

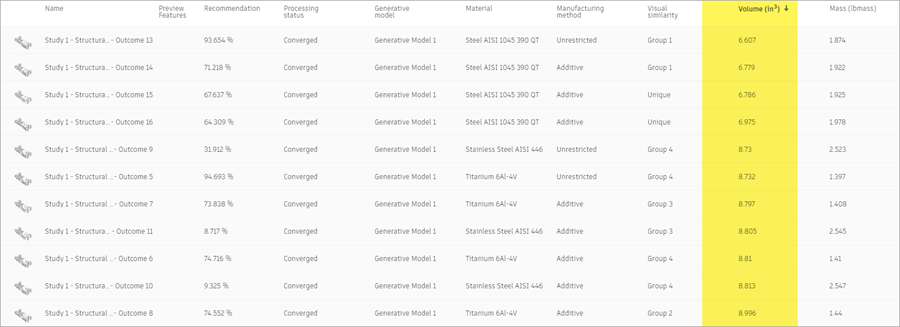
- To sort outcomes by volume, in the table, click the Volume (in^3) column header.

- On the Explore tab, click Display > Table View
Open the top outcome in the Outcome View to review its details.
- To open an outcome in the Outcome View, in the first row, click the thumbnail.

- Review the outcome using the tools on the Outcome View toolbar.
- To return to the Table View, on the Outcome View tab, click Finish Outcome View > Finish Outcome View
 .
.
- To open an outcome in the Outcome View, in the first row, click the thumbnail.
Compare the outcomes in the top four rows.
- To select multiple outcomes, Shift+click each of the first four rows, as shown in the following image.

- To open the selected outcomes in the Comparison View, at the bottom, in the Multiple Selection card, click the Compare icon
 .
. - Compare the outcomes using the tools on the Outcome View toolbar.
- To return to the Table View, on the Outcome View tab, click Finish Outcome View > Finish Outcome View
 .
.
- To select multiple outcomes, Shift+click each of the first four rows, as shown in the following image.
Activity 8 summary
In this activity, you used Table View to sort outcomes, open an outcome in the Outcome View, and compare multiple outcomes.