Activity 7: Explore outcomes using a scatter plot
In this activity, you use the Scatter Plot View to select values to show on the chart axes and choose outcomes for comparison.
Prerequisites
- The previous activity has been completed.
- All outcomes, including those selected for comparison, are shown in the Explore contextual environment in the Properties View.
Steps
In Scatter Plot View, change values to show on the chart axes.
- On the Explore tab, click Display > Scatter Plot View
 .
.
When you switch between views, outcome selections persist and are shown as bold markers in the Scatter Plot View.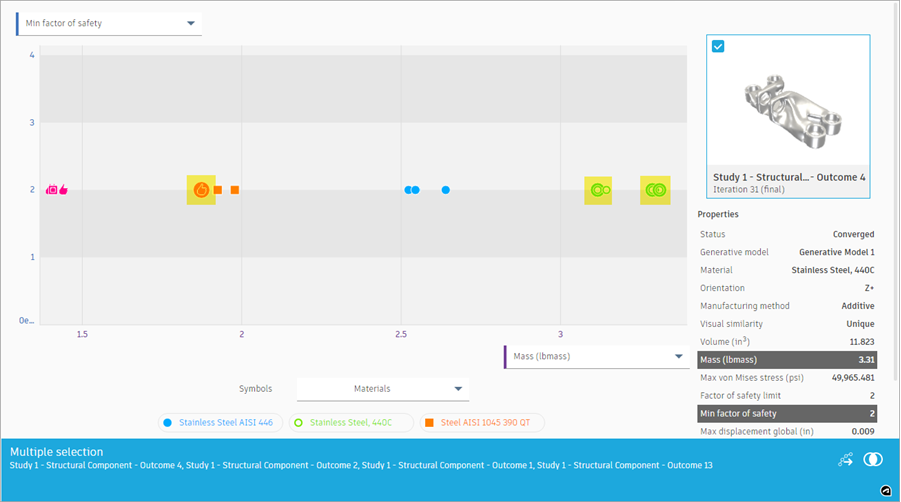
- From the Vertical Axis Properties drop-down list, select Max Von Mises Stress.
The performance of outcomes is shown in terms of the maximum Von Mises Stress (1), Mass (2), and Material (3).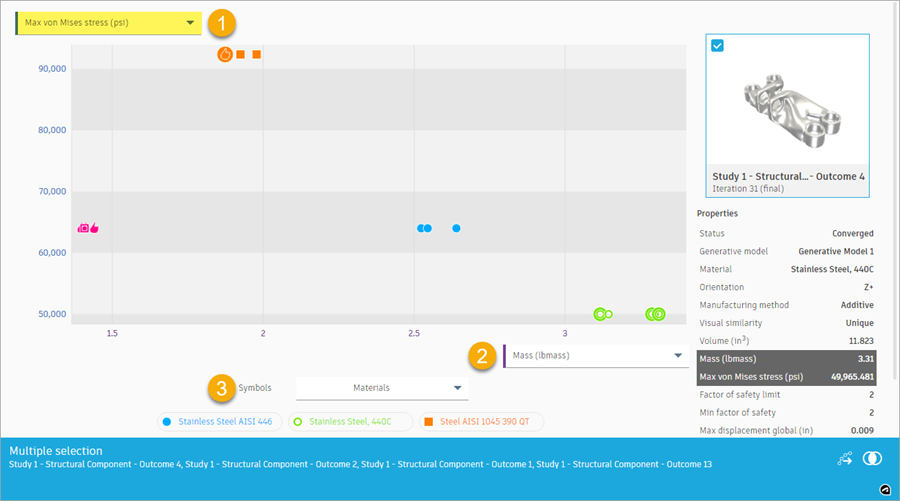
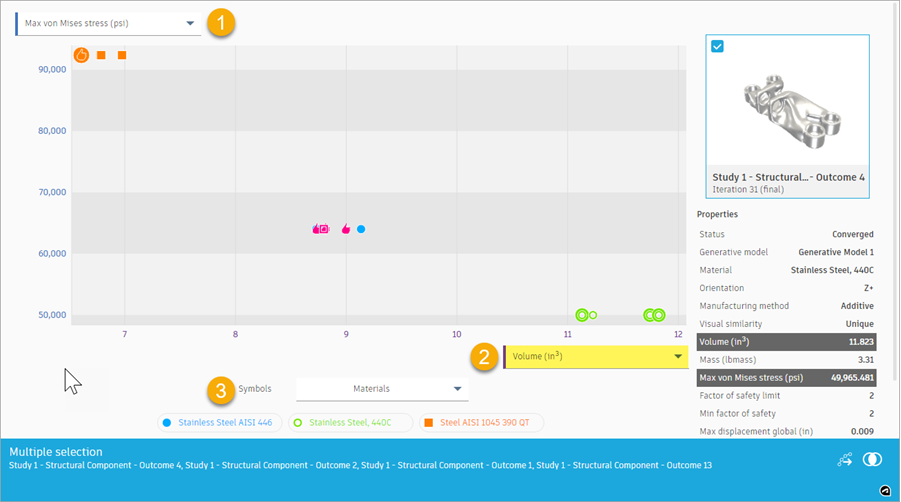
- From the Horizontal Axis Properties drop-down list (2), select Volume.
The performance outcomes are shown in terms of the maximum Von Mises Stress (1), Volume (2), and Material(3).
- On the Explore tab, click Display > Scatter Plot View
Zoom in on one of the outcome and show its properties.
Note: The outcomes represented by markers in your scatter plot may differ slightly than the images shown.- Click anywhere in the scatter plot to clear the outcome selection.
- Drag to zoom in on the area shown in the following image.
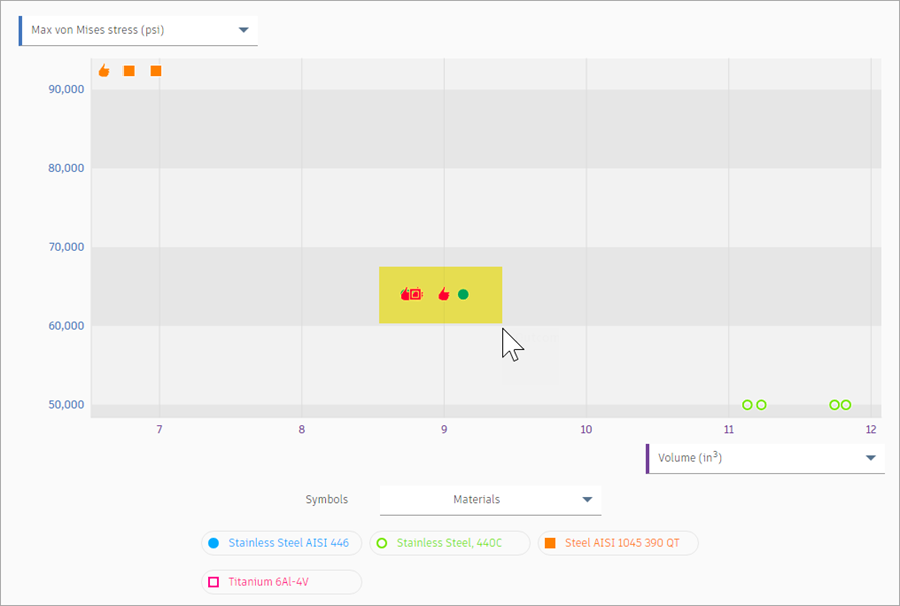
- Place the mouse pointer over the last marker on the right.
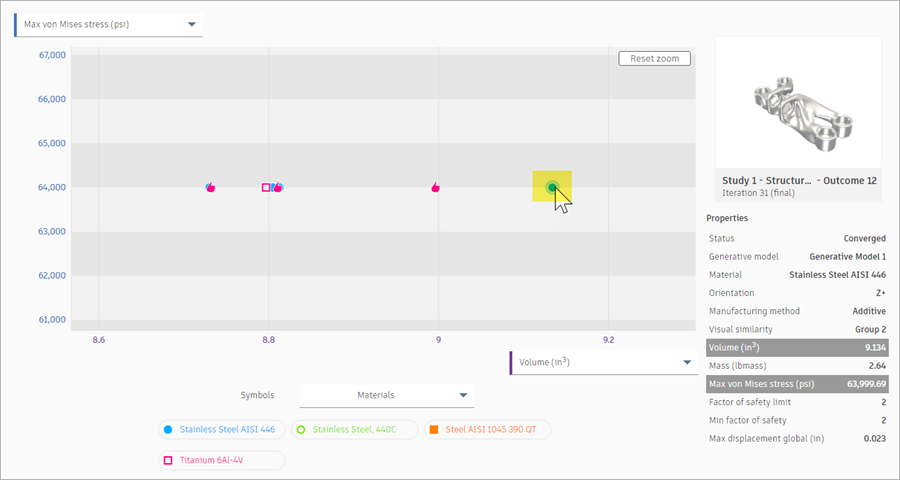
Note: In the Properties panel, you can view the thumbnail and properties of this outcome. Volume and Max Von Mises Stress are highlighted because they are set on the scatter plot axes.
Tip: Double-click an outcome to show it in the Outcome View.
Select and compare multiple outcomes.
- To clear the outcome selection, click anywhere in the scatter plot.
- To select multiple outcomes, Shift+click four outcome markers as shown in the following image.
Note: The outcomes represented by markers in your scatter plot may differ slightly than the images shown.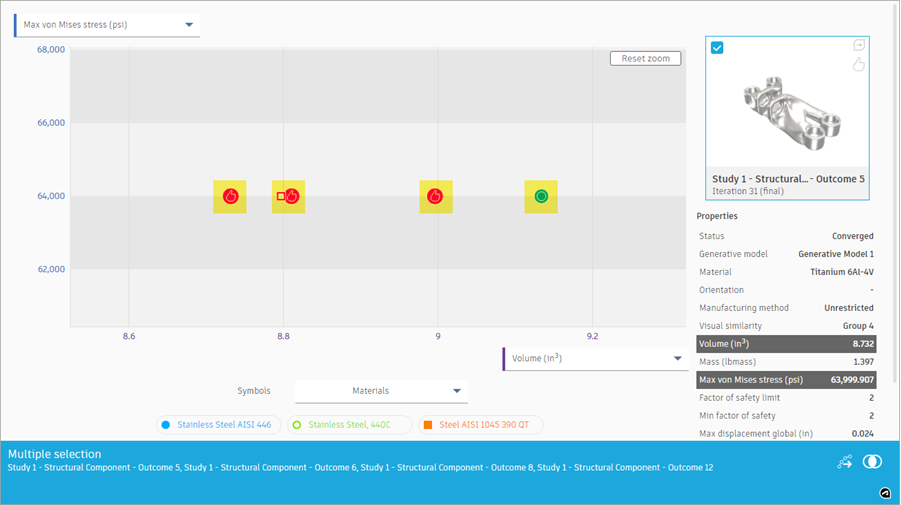
- To open the selected outcomes in the Comparison View, at the bottom, in the Multiple Selection card, click the Compare icon
 .
. - Compare the outcomes using the tools on the Outcome View toolbar.
- To return to the Scatter Plot View, on the Outcome View tab, click Finish Outcome View > Finish Outcome View
 .
.
Activity 7 summary
In this activity, you used the Scatter Plot View to select values to show on the chart axes and chose outcomes to compare.