Activity 3: Solve the analysis and interpret the results
In this activity, you
- Run the analysis
- View the results to determine whether the plastic table is likely to buckle
- Animate and view the 3 vibration modes, to identify the mode with the lowest buckling load factor.
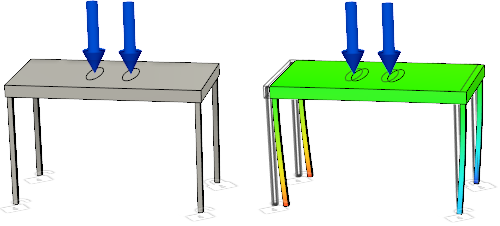
Plastic table before analysis (left) and Plastic table Total Displacement result for Mode 1 (right).
Prerequisites
- Activity 2 is complete.
Steps
Solve the study.
- Click
 (Simulation workspace > Setup tab > Solve panel > Solve), to open the Solve dialog.
Note: The Pre-check icon shows a green checkmark, which indicates that there are no warnings and the model is ready to solve.
 - Click Solve 1 Study to run the analysis and close the dialog.
Note: Meshing and solving the analysis can take several minutes.
- When the analysis is complete, click Close to close the Job Status dialog.
The Results tab opens automatically, so you can view the results.
- Click
Animate the Total Displacement result for Mode 1 using the animation bar to demonstrate the full buckling displacement cycle.
- In the Browser, confirm that Total Displacement is selected.
- From the Mode dropdown above the legend, confirm that Mode 1 is selected.
- On the animation bar at the bottom of the canvas, click the Playback button and select Mirror loop, if it is not already selected.
- Click
 Options on the animation bar. Set Speed to 2x.
 - Click
 Play.
Play.
While the animation is still running, choose the next mode from the Mode dropdown above the legend. Observe the shape of this mode. Repeat until you have seen all three modes, then click
 Stop on the animation bar to end playback.
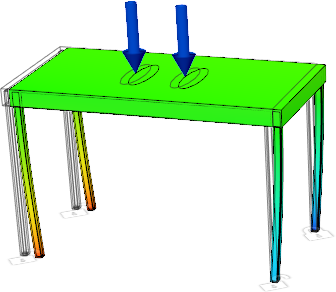
Your Mode 1 result should look like the following image:
Typically you look for the lowest buckling load factor from the different modes.
Notice that the first mode has the lowest buckling load factor. All three modes have a buckling load factor less than one, which means that buckling occurs. Generally, the result you want is the first positive load factor. The shape created in buckling analyses is based on natural frequency shapes, thus the shape can be displayed as the mirror of how buckling actually occurs. For example, the picture shown above has the legs pointing inward for the displacement, where we would expect the legs to go outward to collapse.
If you run a static stress analysis with the same settings, you get a factor of safety greater than 10. A high factor of safety is misleading, and suggests that the design is viable. This is why you should run both a static stress and a structural buckling analysis.
As with any design problem, there is more than one solution you can use to avoid buckling. In the next activity, you clone the study and change the material.
Activity 3 summary
In this activity, you
- Ran the analysis
- Viewed the results to determine whether the plastic table is likely to buckle
- Animated and view the 3 vibration modes, to identify the mode with the lowest buckling load factor.