Activity 3: Solve the analysis and view the results
In this activity, you
Run the analysis
Find the minimum and maximum temperatures locations
Check the temperatures throughout the model, to see the temperature distribution
Identify the regions of highest heat flux.

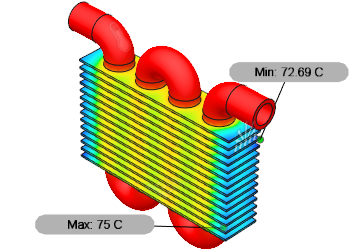
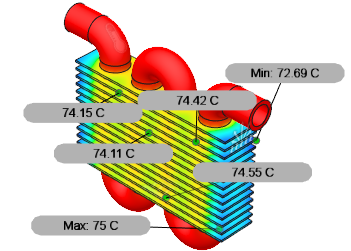
Radiator model ready for analysis (left). Radiator model, with thermal analysis temperature results (right).
Prerequisites
- Activity 2 is complete.
Steps
Solve the study.
- Click
 (Simulation workspace > Setup tab > Solve panel > Solve), to open the Solve dialog.
 - Click Solve to start the analysis and close the Solve dialog.
- When the analysis is complete, click Close to close the Job Status dialog.
The Results tab opens automatically, so you can view the results.
- Click
Find the minimum and maximum temperature, in Celsius, across the radiator.
- Temperature is the default result shown. If it is not, in the Results browser on the left, select Temperature from the result folder.
The minimum and maximum temperatures are shown automatically. To turn them off, click
 (Simulation workspace > Results tab > Inspect panel > Hide Min/Max)
 - Click
 Result Settings above the legend, and change the result unit from K to C.
Note: The temperatures may vary slightly from the image, because the mesh is comparatively coarse.

The minimum temperature is over 70 degrees which can burn skin in under a second. You can also see bands of higher temperatures on the fins closest to the pipe.
- Temperature is the default result shown. If it is not, in the Results browser on the left, select Temperature from the result folder.
Create Surface Probes to inspect the high temperatures.
- Click
 (Simulation workspace > Results tab > Inspect panel > Create Surface Probes)
 - Click the model at the edges of the fins in the higher temperature regions in a few places.
- In the Create Surface Probes dialog, click OK to stop creating probes.
- Compare the probes to validate there are no outliers that indicate that you may have misplaced a probe.

- Click
 (Simulation workspace > Results tab > Inspect panel > Hide All Probes), to hide the surface probes.
- Click
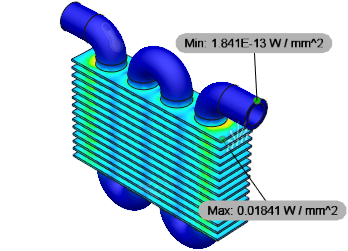
Identify the areas of highest and lowest heat flux.
- In the Results browser on the left, select Heat Flux from the result folder.

- Zoom in on the indicated areas to identify where they are on the model. You are looking at where the energy is able to move most efficiently. Notice that the highest heat flux is where the cooler fins meet the hot pipes. The lowest heat flux in the model is located away from the aluminum fins, where the pipes are in contact with air.
- Click
 Finish Results to close the Results tab and return to the Setup tab.
- In the Results browser on the left, select Heat Flux from the result folder.
Activity 3 summary
In this activity, you
- Ran the analysis
- Found the minimum and maximum temperatures locations
- Checked the temperatures throughout the model, to see the temperature distribution
- Identified the regions of highest heat flux.
You discovered that the temperatures are too high throughout the model. The highest heat flux is near the ends of the fins where they extend furthest from the pipes. You can increase the surface area of the fins to reduce the temperature of the model.