Activity 4: Review the results of Study 1 - Static Stress
In this activity, you
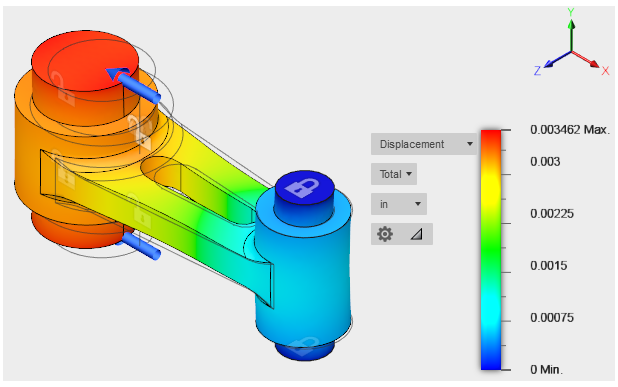
- View the Total Displacement results
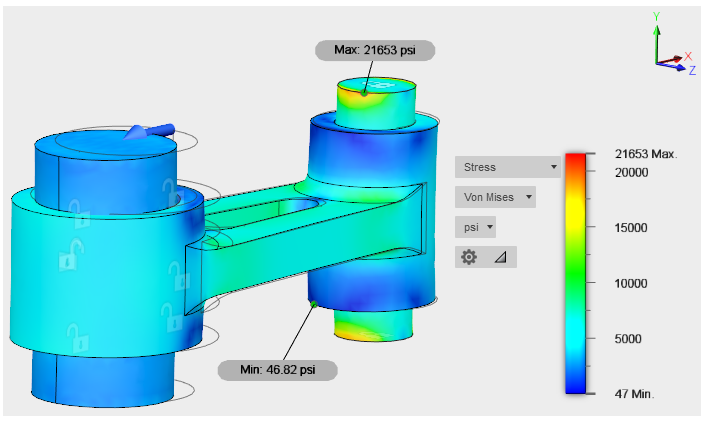
- View the von Mises Stress results, and identify where the minumum and maximum stress occurs.
After you run a second study, you will compare the results of Study 1 with those of Study 2.
Prerequisties
- Activity 3 is complete.
Steps
Switch results to view the Total Displacement results. Note: When the solution is finished, the safety factor results are shown initially.
- To switch results, click the Results drop-down list next to the plot legend, and select Displacement.

- To switch results, click the Results drop-down list next to the plot legend, and select Displacement.
Switch to view the von Mises Stress results, show markers at the minimum and maximum stress points, and rotate the model to examine the results.
- To switch results, click the Results drop-down list next to the plot legend, and select Stress.
The type of stress result initially displayed by default is the von Mises stress. - Click
 (Simulation workspace > Results tab > Inspect panel > Show Min/Max) to show markers at the points of the minimum and maximum von Mises stress results.
 - While holding down the Shift key, click the middle mouse button and drag the mouse to rotate the model viewpoint. Position the view so that you can clearly see the maximum and minimum stress points.
Note: You can click and drag the Min and Max value balloons to a different position, as desired.
- To switch results, click the Results drop-down list next to the plot legend, and select Stress.
Restore the Default Displacement results and Isometric View.
- Click
 (Simulation workspace > Results tab > Inspect panel > Hide Min/Max) to hide the min/max markers.
 - Click the Results drop-down arrow next to the plot legend, and select Displacement.
Once again, the total displacement results are displayed. - Click the Home icon
 that appears above the ViewCube when the cursor is near. The display returns to the default isometric view of the model.
- Click
Activity 4 summary
In this activity, you
- Viewed the Total Displacement results
- Viewed the von Mises Stress results, and identified where the minumum and maximum stress occurs.