Online viewer - Guided results
Information in this section applies specifically to results generated by the following simulation studies:
- Electronics cooling
- Injection Molding Simulation
Guided results interpret the data and provide you with the answers to fundamental questions you might ask when running a given study. In addition, Guided Results provide you with suggestions for steps you can take to improve the results.
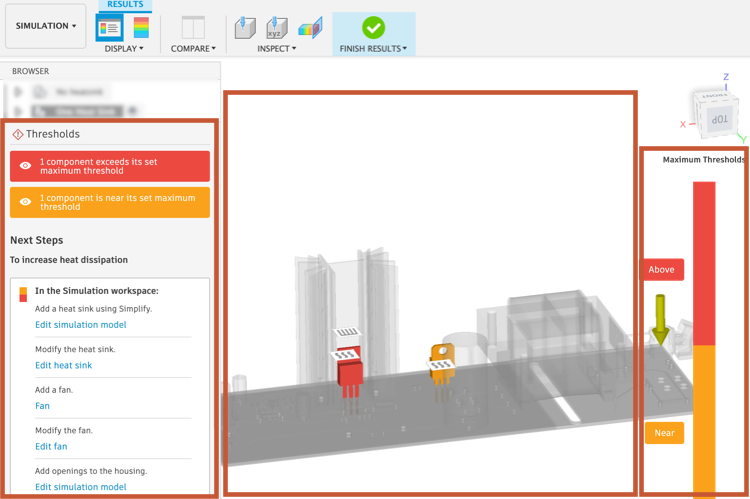
The graphical window for these simulation studies has three (3) main components:
A Result browser that provides an interpretion of the result and lists potential Next Steps to take to improve the result
A 3D Volume graphical display of the model showing the selected result variable in the canvas.
An interactive Legend which you can click to ghost components, so you can focus on specific areas.

Note: For optimal performance, ensure you have installed the latest driver for your graphics card.