After you run a deterioration model, you can view the results per asset or per group. Use the Assets view to inspect individual assets and their Failure Grade, or Groups to compare deterioration curves and see when each group crosses the failure threshold.
How to read a result
There are three important pieces of information for each asset:
- Failure Probability (%) - how likely the asset is to fail right now, based on its age and on its group's survival curve. Higher values means more likely to fail.
- RUL Years (80%) - Remaining Useful Life: roughly how many years until the asset reaches the 80% failure-probability threshold. The lower the value, the closer the asset is to the end of it's useful life
- Grade - a single risk category (Optimal → Stable → Moderate → Concerning → Critical) that combines the two above, so you can prioritize at a glance.
High Failure Probability + low Remaining Useful Life = higher risk (a Concerning or Critical grade) - those are the assets to review first. To see why any single asset got its scores, select See curve at the end of its row in the table.
Assets view
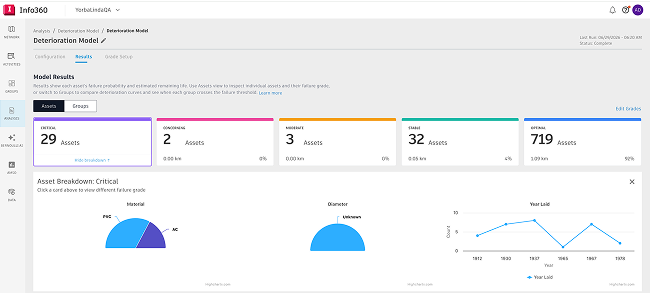
Failure Grade cards.
A card for each grade - Critical, Concerning, Moderate, Stable, Optimal - shows the number of assets in that grade, their total length, and the percentage of all modeled assets.
Select a card (or its See breakdown link) to break that grade's assets down by Material, Diameter, and Year Laid - shown as charts with the percentage and asset count for each. Select Hide breakdown to close it.
Search. Find an asset by Asset ID or another searchable value.
The asset table includes:
- Asset ID - unique identifier (select it to open the asset's details).
- Group - the asset group this asset belongs to.
- Material, Diameter, Installation Year - asset attributes.
- Failure Prob. (%) - the asset's current probability of failure.
- RUL Years (80%) - estimated years until the asset reaches the 80% failure-probability threshold.
- Age (Years) - current asset age, on the day when results were generated.
- Expected Failure Year - projected year of end of life.
- Past Failure Type — the type of historical failure recorded for this asset. Only failure types defined in the model's Failure Definition and matched to the asset are shown.
- Grade - the asset's Failure Grade (configured in the Grade Setup tab).
How results are calculated
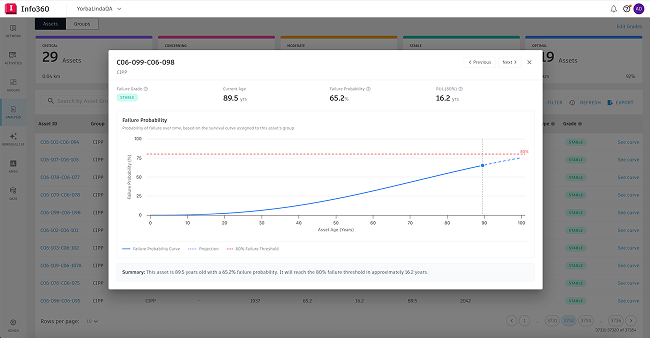
On any asset row, select See curve to view the asset on its group's survival curve. You'll see its current age, its current failure probability, its position on the curve, and when it's expected to reach the 80% failure threshold - plus a plain-language summary, for example: "This asset is 87 years old with a 22% failure probability. It's expected to reach the 80% failure threshold in approximately 44 years." This helps you understand why an asset received its scores and defend the decisions that follow. For how the scores are modeled, see About Survival Curves and About Failure Grades
Export. Select Export to download the results (the export includes all results, not only the current page).
Why some assets have no results.
There are two reasons an asset may not have a full set of results:
- Its group has no survival curve. If an asset group's curve method is undefined, that group is excluded from the model run, so its assets don't get deterioration results. A group's method may be undefined if:
- no failure definition was selected for the model, or
- the group has fewer than 5 failures for the selected failure definition - not enough data to fit a curve (a group needs at least 5).
To include these assets, assign a survival curve method to the affected groups on the Configuration tab, then run the model again. See Select Survival Curve Method.
- The asset has no installation date. If an asset is missing its installation date, its age can't be calculated, so it can't be placed on the survival curve. The asset still appears in the table, but its Failure Probability, RUL Years (80%), and Expected Failure Year show as "—". Add the installation date to the asset and re-run the model to get results for it.
Groups view
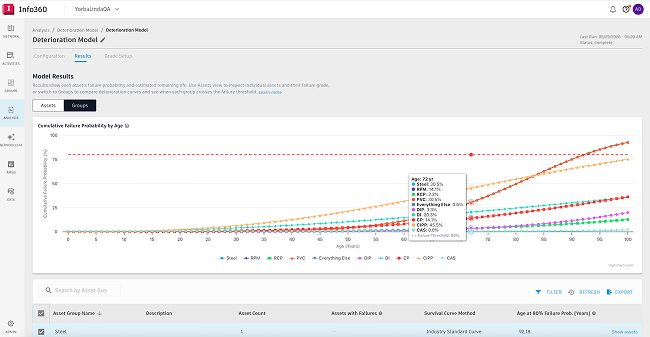
The Groups view tab The Groups tab shows how each asset group deteriorates as a whole, so you can compare groups instead of looking at assets one by one.
The chart - cumulative failure probability over time. Each colored line is one asset group. The line shows the group's cumulative failure probability - the share of the group expected to have failed by a given age. It starts low and rises toward 100% as assets age; the steeper the line, the faster that group is deteriorating.
Use it to answer questions like:
- Which groups are aging fastest? The steepest, left-most curves.
- Which will need attention first? The ones that reach high failure probability at a younger age.
- How do materials or installation eras compare? Put two groups side by side and see which one holds up longer.
The group table includes:
- Asset Group Name - name of the group.
- Description - group description.
- Asset Count - number of assets in the group.
- Assets with Failures - number of assets with a recorded historical failure.
- Survival Curve Method - the method used to generate the group's curve.
- Age at 80% Failure Prob. (Years) - the age at which the group reaches an 80% failure probability. Think of it as the group's expected "high-risk age": a lower number means the group reaches high risk sooner (deteriorates faster), a higher number means it's expected to last longer. It's a quick way to rank groups by expected service life.
Select Show assets to open the Assets view filtered to that group. Use the toolbar to filter, refresh, or export the group results.
Using the results
The deterioration results turn "we can't inspect everything" into a clear, network-wide view of where to act first. Use them to:
- spot the assets that need attention - start with the Critical and Concerning grades;
- compare groups and see which are deteriorating fastest (lowest Age at 80% Failure Prob.);
- prioritize rehabilitation or replacement, and support capital and budget planning with defensible, data-based reasoning.
Take the results further - into risk and rehabilitation workflows. Deterioration outputs don't have to stay on this page. You can bring Failure Grade, Remaining Useful Life (RUL), and Failure Probability into your:
- Risk configurations - so an asset's risk score reflects its predicted condition, not just static attributes (for example, a high Failure Probability or a Critical grade raises its risk).
- Rehabilitation decision trees - so rehab and renewal recommendations are driven by deterioration (for example, a low RUL or a Critical grade routes an asset toward replacement).
This connects prediction to action: the model tells you what's likely to fail and when, and your risk and rehab workflows turn that into what to do about it.