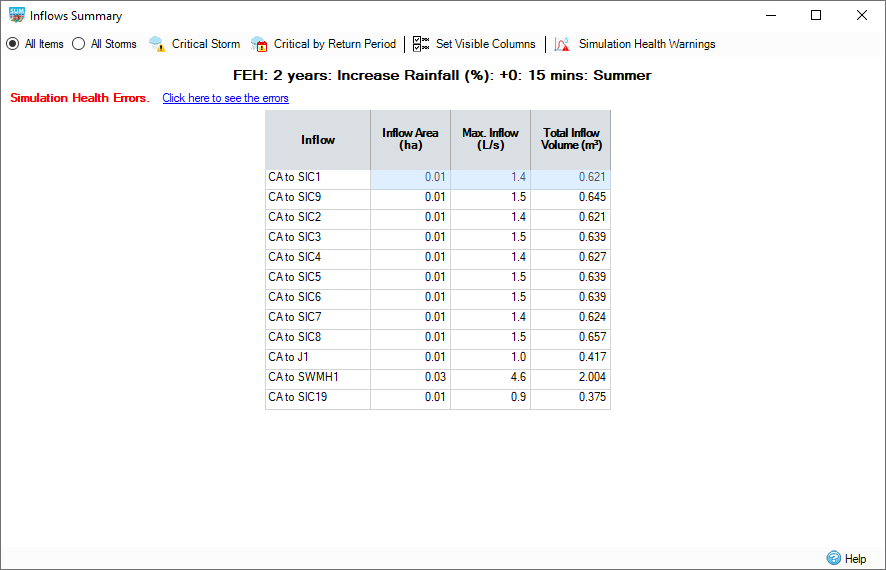
The Inflow Summary Results shows a summary of how each Inflow in the current phase performed.

Filtering the Results
For phases containing only Baseflow or Input Hydrographs filtering will not be available.
When the All Items radio button is selected, the summary shows the maximum flow rates entering and leaving together with details of the volumes for each of the Inflow in the Phase for the current storm/event as highlighted on the Storm Selector on the Status Bar. The Select Filter drop down filters the results to show All Items or a selected Flow Paths.
When the All Storms radio button is selected, the summary shows the maximum flow rates in and out of the Inflows selected in the Select Item drop down, together with details of the volumes for each of the storms run. This is of most interest when Rainfall with multiple storms is selected on the Analysis Criteria.
Critical Storm
When pressed, the Critical Storm toggle button will display the critical storm in the following ways:
- When the All Items radio button is selected, the critical storm and its results for each Inflow are displayed, rather than the selected storm.
- When the All Storms radio button is selected, the row containing the critical storm for the currently selected Inflow is highlighted in orange. If two or more storms are critical only the first one will be highlighted.
The critical storm for an Inflow is defined to be that storm that has the largest Max Inflow result.
For ARR 19 Rainfall the Max Inflow property is used to determine which of the 10 temporal patterns run for an AEP / Increase Rainfall / Storm Duration set has the value which is the first temporal pattern above the mean (average) over the 10 results for the given property.
For example, the table below represents the Max Inflow values for the given temporal pattern
| Temporal Patterns | ||||||||||
|---|---|---|---|---|---|---|---|---|---|---|
| 1 | 2 | 3 | 4 | 5 | 6 | 7 | 8 | 9 | 10 | |
| Max Average Depth | 5.5 | 6.2 | 3.1 | 4.5 | 2.6 | 1.5 | 4.87 | 3.65 | 1.56 | 5.56 |
mean = (5.5 + 6.2 + 3.1 + 4.5 + 2.6 + 1.5 + 4.87 + 3.65 + 1.56 + 5.56) / 10 =3.904
The first temporal pattern above the mean is Temporal Pattern 4 (4.5), which will then be used for the Critical Storm and Critical by Return Period comparisons.
Critical by Return Period
When pressed, the Critical by Return Period toggle button will display the critical storm for the return period / increase rainfall grouping from the currently selected storm.
The return period / increase rainfall groupings are as follows for the given rainfall sets:
FEH / FSR / Chinese Design - grouped by Return Period and Increase Rainfall from the current storm. e.g if the current storm is FEH: 5 years: +30%: 120mins Winter - then the critical storm will be identified from all the results for FEH 5year + 30% storm duration range.
ARR - grouped by AEP and Increase Rainfall from the current storm. e.g if the current storm is ARR: 50 %: +30%: 120mins - then the critical storm will be identified from all the results for ARR 5% + 30% storm duration range.
Desbordes / Known / User Defined - grouped by Increase Rainfall from the current storm. e.g if the currrent storm is Desbordes: 5 years: +10%: 15mins - then the critical storm will be identified from all the results for Desbordes +10% storm duration range.
SCS - no grouping. All SCS results are considered.
- When the All Items radio button is selected, the critical storm and its results for each Inflow are displayed, rather than the selected storm.
- When the All Storms radio button is selected, the row containing the critical storm for the currently selected Inflow is highlighted in orange. If two or more storms are critical only the first one will be highlighted.
The critical storm for an Inflow is defined to be that storm that has the largest Max Inflow result.
Spreadsheet Preferences
Fields can be turned on or off using the Spreadsheet Preferences form that is accessed from the toolbar at the top of the form. The full set of columns available are shown and can be turned on or off using the check boxes. These settings will be remembered between sessions.
Simulation Health
If the results of the analysis are showing issues for the current storm, or one of the storms if showing critical/all storms, a message will be shown at the top of the form. More information can be found in the Simulation Health section.
Additionally, the simulation health warning hyperlink can be clicked to display the Simulation Health Warnings for the current phase.
Results
Inflow - The name of the Inflow item.
Inflow Area - The area of the Inflow for the selected or displayed rainfall event, left blank for Hydrographs and Base Flows.
Max Inflow - The maximum inflow reached for the selected or displayed rainfall event.
Total Inflow Volume - The total volume generated by the inflow for the selected or displayed rainfall event.