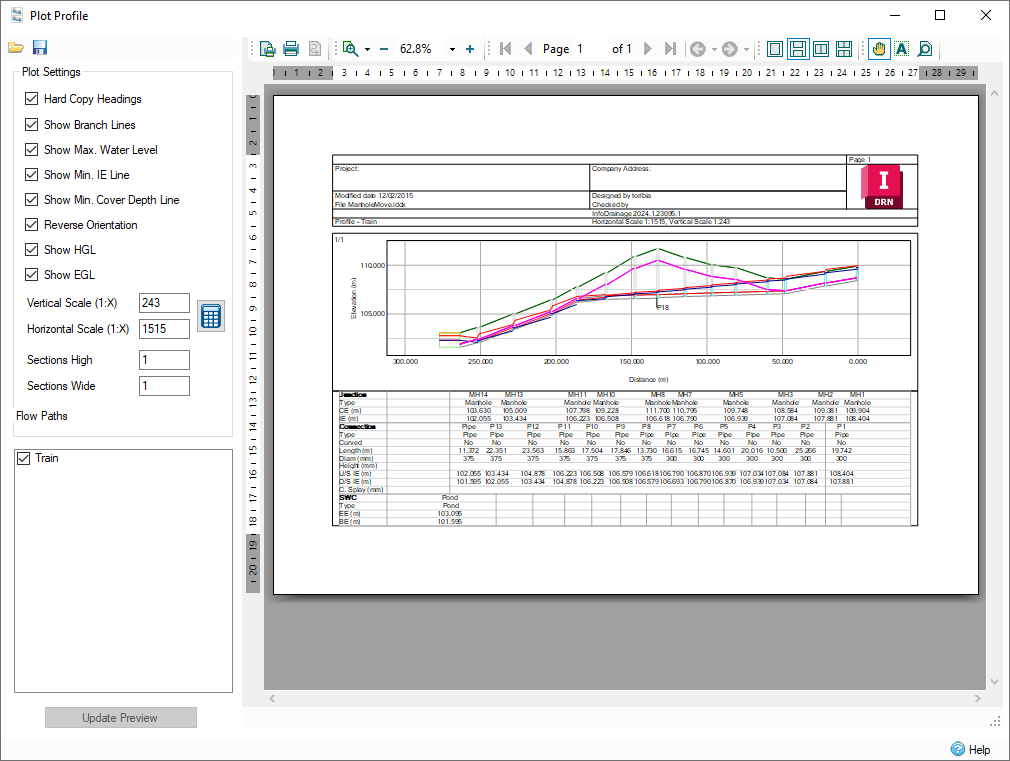
The Plot Profile screen can be accessed from the File menu by selecting Plot Preview, or by clicking the toolbar button in Profile View. This window allows you to preview all of the available Flow Paths Profile, and how they will be plotted. The user can select their desired scales and finally output the plots to a printer for distribution.

Usage
A settings frame is shown along the left hand border, with additional settings available in Page Setup.
Once settings have been chosen, the Update Preview button can be pressed to see the selected flow paths.
When the user is happy with the preview, they can select the Print button in the toolbar to plot the preview to a printer of their choice. Selecting Color or Black and White printing should be done at this stage.
Navigation
When multiple pages of plot are shown at once, a scrollbar will appear on the right hand side of the preview. The toolbar also contains multiple options for navigation and page layout within the preview.
Plot Settings
Multiple settings are available to help with layout and scaling. To allow ease of use, these settings can be saved and loaded from a specific file via the toolbar buttons.
Page Setup
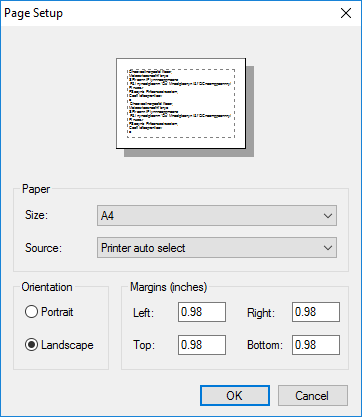
Physical settings such as the paper size, margins, and page orientation can all be accessed from the Page Setup toolbar item.

Hard Copy
The Hard Copy header table can be turned on or off with this option. Note that the currently selected Profile title and Scales will always be displayed, regardless of the Hard Copy setting. For information about editing the Hard Copy contents, see Hard Copy Headings.
Show Branch Lines
This option allows the incoming branch lines to be drawn on the plot, along with an appropriate label for identification.
Show Max. Water Level
The Show Max. Water Level checkbox allows the current storms maximum water level to be drawn on the plot. This option will only be enabled if there are results available (that is, the site has been analyzed).
To change the currently active storm, use the drop-down menu available at the bottom of the Plan view, in the Status Bar.
Reverse Orientation
This option allows for the profile to be drawn in reverse order, from the lowest item to the highest. The origin of the path is still considered to be the start of the highest item.
Show HGL
The Show HGL checkbox allows the current storms Hydraulic Grade Line to be drawn on the plot. This option will only be enabled if there are results available (that is, the site has been analyzed).
Show EGL
The Show EGL checkbox allows the current storms Energy Grade Line to be drawn on the plot. This option will only be enabled if there are results available (that is, the site has been analyzed).
Scales
These two boxes allow the user to specify the Vertical and Horizontal Scales that should be applied to the plots. Red values indicate that the user has specified the displayed scales – these will be saved between sessions.
Gray values in the scale boxes indicate that the scales have been generated by the system – this is the default state. These scales are excellent to use as a starting point for your plot. If the user inputs values, the AutoScale will be turned off, which can be re-enabled by clicking the Apply Auto Scale button to the right of the scale boxes.
User Input scales (red values) are applied to all selected profiles. When auto scale is on, scales will be generated for each selected profile individually – check the page header to see the scale used.
Section layout
For larger page layouts, it can often be useful to display numerous segments in portions of the page. The Section text boxes can be used to specify a layout for the page. Segments will increment in order from left to right, top to bottom.
Flow Paths
All available flow paths in the current phase will be shown in the Flow Paths box. These can be selected in any combination to be plotted at once. There will always be a page break between separate flow paths.