Flexible Reporting enables the flexible data extraction of properties associated with pipes, structures, subcatchments and Stormwater Controls. You can combine all of these properties based on connectivity to help produce reports to satisfy various approval requirements.
Any item in the design that is not associated with connection will not be included in Flexible Reporting.
Flexible Reporting is accessed via the File menu.

Toolbar
The following options are available:

Load Template - Load a report configuration.
Save Template - Save the current configuration of the report.
Clear All - Unselect all items from the Selector View and remove all columns from the Grid View .
Auto Refresh - Automatically generates the Flexible reporting table when properties are selected. With larger models it is recommended to have this option turned off. The table will be refreshed once the toggle is switched back to "On".
Selector View
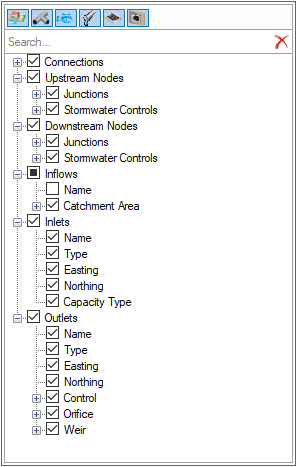
The main purpose of the Selector View is to select which items and which columns will be visible in the Grid View. The Selector View can be collapsed by sliding left or clicking the separator between the Selector View and the Grid View.

Item Selector
The item selector allows you to control the visibility of different items types (Inflows, Junctions, Stormwater Controls, Connections, Inlets and Outlets) and their associated columns in the grid. It also controls the item properties displayed in the property tree.
Results are available under each of the items if an analysis has been performed. These allow the same Summary information to be shown for each item as the overall Results forms.
Search Bar
The Search Bar allows a quick filtering of the items displayed in the property tree. Type one or several characters, these will be searched within all the property names, in any position (beginning, middle or end of any part of a property name).
Property Tree
The item selector allows you to manage the visibility of items and their associated columns in the grid. Properties related to a selected item are grouped together in a hierarchized and collapsible tree view.
Filters
These features help you filter data so that you just access what is important to you.

Phase Filter
Display only the items associated with a given phase. This filter cannot be changed in this version of the software. Note that the Phase shown in Tables is synced with the Phase shown in the general InfoDrainage window.
Flow path Filter
You can either decide to display “All” items available or only items on a given flow path from the selected phase.
Storm Filter
The Storm Filter allows to display the result values associated to a storm after analyzing the design. This is synchronized with the Status Bar so changes here will update the other results shown in the software and vice versa.
Critical Storm
When the Critical Storm toggle button is pressed, the results from the Critical Storm for each Connection, Junction, Stormwater Control, or Inflow are displayed, instead of the results from the event selected in the Storm Filter.
The critical storm for a Connection, Junction, or Stormwater Control is defined as the storm that results in the largest value for the Critical Rank By property. The Critical Rank By property used for each item type can be selected on the Connections Summary, Junctions Summary, and Stormwater Controls Summary.
The critical storm for an Inflow is defined as the storm that results in the largest Max Inflow value. Further details can be found on the Inflows Summary page.
Grid View
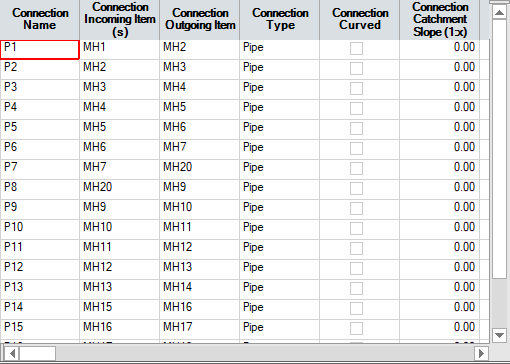
This is the component where the objects and their properties are displayed. Tables is a multidimensional view, it reflects data which you can access from the editor form of each items. Data is sorted and hierarchized to simplify browsing through the different parameters of items available in your design

Grid Sorting
This provides a sorting mechanism to the Grid View. You can select a column and sort the whole report by the column’s values, based on the sort selected - ascending or descending.
