This tutorial introduces InfoWater Pro's fireflow simulation capabilities. InfoWater Pro calculates fireflow results (i.e., residual pressures, available flows, and design flows) for each junction node in the fireflow set (i.e., junction nodes assigned fireflow demands) one junction node at a time. Fireflows are calculated for any single simulation time period. Fire hydrants are represented as junction nodes in InfoWater Pro.
The estimated time to complete this section is approximately 45 minutes. If you have not completed the previous tutorial, then you should use the “Sample” project in the InfoWater Pro Quick Start Tutorial Example files. Refer to the Quick Start Tutorial for more information on opening an InfoWater Pro project.
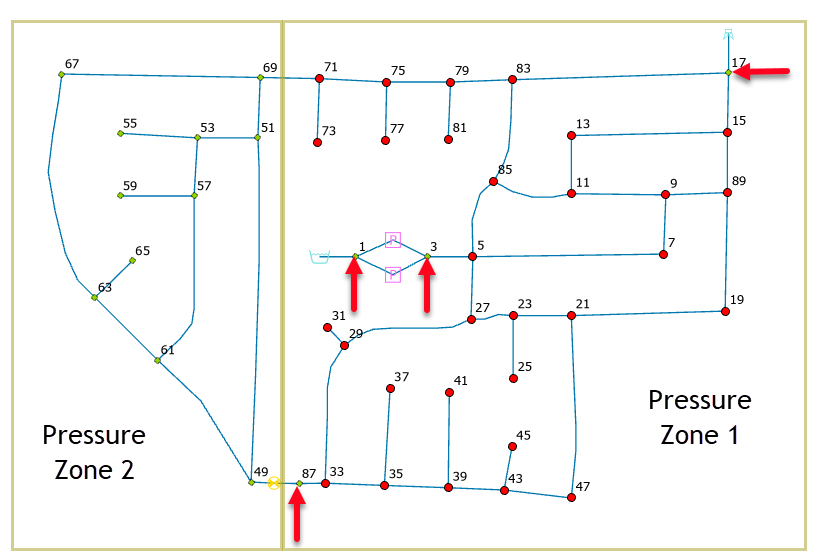
The tutorial demonstrates the standard fireflow simulation capability. You will calculate fireflows for all junction nodes in Pressure Zone 1 except for the following junction nodes 1, 3, 17, and 87. The remaining junction nodes in Pressure Zone 1 will be assigned a fireflow demand of 1,000 gpm. All junctions in Pressure Zone 1 that are not indicated with a Red Arrow will be assigned a Fireflow demand and will be included in the Fireflow simulation. The junction nodes in red will be assigned with a fireflow demand and they will be included in the fireflow simulation.
Step 1: Specifying Fireflow Demands
Fireflow demands are stored separately from static demands. When performing a fireflow simulation, InfoWater Pro considers the cumulative demand at the junction node at the fireflow time period.
- You can assign fireflow demands to junction nodes one at a time by clicking on the
Select Element
 icon from the
Edit group in InfoWater Pro ribbon, and then by graphically picking the desired junction.
- Click on the
Tools
 icon of the Model Explorer - Attribute Tab window, and then choose the
Fireflow command. Enter the appropriate fireflow demand in the Junction Fireflow dialog box. Alternately you can assign a common fireflow demand to all junction nodes in the current network domain. Given the large number of junction nodes to be included in our simulation (most in pressure zone 1), the latter option is illustrated here.
Create A Domain
All junction nodes in this Tutorial model have been assigned a pressure zone designation of “1” or “2”. Using this information in the project database, you can select all junction nodes in Pressure Zone 1. Then you will manually remove junction nodes 1, 3, 17, and 87 from the domain.
- Open your tutorial model, and click on the
InfoWater Pro
 button to initialize the model. Note: This tutorial is a continuation of the model used in the main Quick Start Tutorial, and you are expected to use the completed model from the tutorial as the starting basis for this fireflow tutorial. If you have not already completed the Quick Start Tutorial, Innovyze strongly recommends that you complete it first before you attempt to work through this extended tutorial on fireflow analysis. If you have not completed the Quick Start Tutorial, please use the Sample.aprx model while in the BASE scenario in the
Quick Start Tutorial Example files for use with this tutorial.
- Choose the
Domain Manager
 button from the InfoWater Pro ribbon. The Domain Manager dialog box appears on the screen.
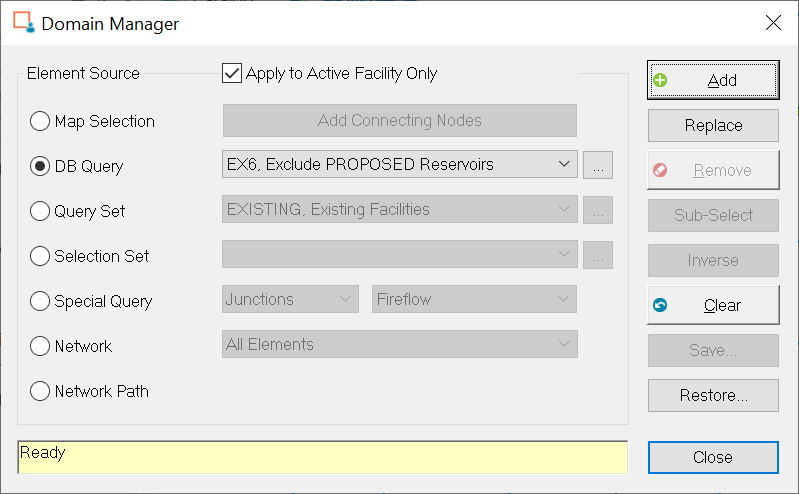
- Select the Clear
 button.
- Choose the DB Query radio button in the
Element Source area, as shown above. Now build a new database query by clicking on the
Browse
 button to the right of DB Query. The DB Query dialog box appears on the screen, as shown below.
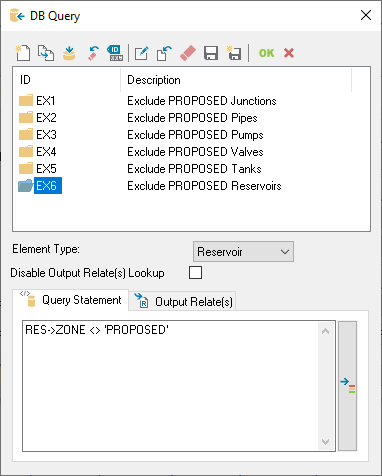
- Choose the New
 button in the upper left-hand corner of the DB Query dialog box.

- Enter a query ID and description as follows: “J_ZONE1, Junctions in Zone 1” (see above) and then click on the OK button.
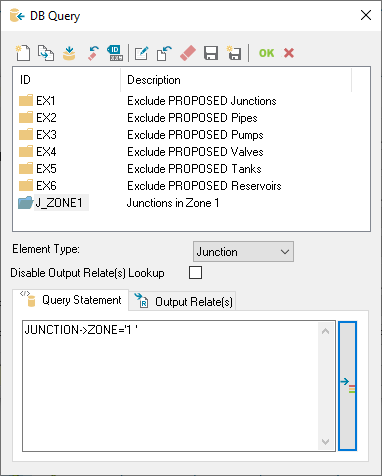
- Choose Junction in the Select Element Type area, and then click on the OK button. The DB Query dialog box should appear as:
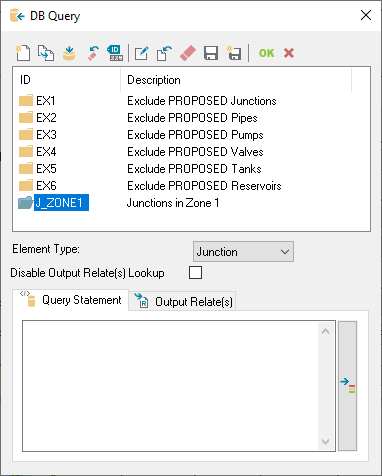
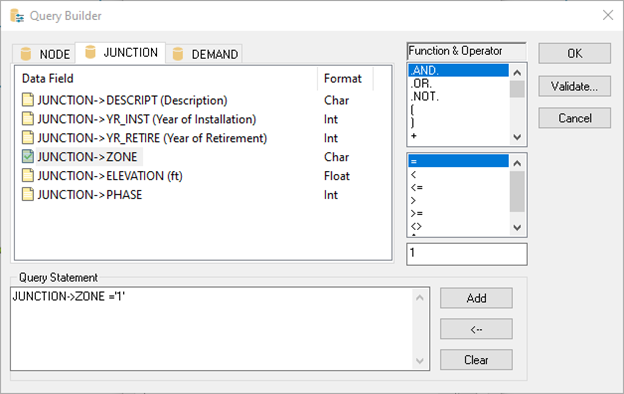
- Select the Query Builder
 button to the right of the DB Query window. Choose the
Junction tab, select the
Junction > Zone data field, select the “=” operator, type “1” in the field below the Function & Operator area, and click on the
Add button.
- The Query Builder dialog box should appear as shown below.
- Click on the Validate button to validate the query statement, and then click on the OK button to close the Query Validation dialog box. Click on the OK button to close the Query Builder dialog box. The DB Query dialog box should appear as:
-
Click on the Save
 button at the top of the DB Query dialog box, and then click on the OK button to return to the Domain Manager. The query “J_ZONE1, Junctions in Zone 1” should now appear as the current query in the DB Query field.
- Choose the New
- Click on the Add button on the Domain Manager, and then close the Domain Manager dialog box. By investigating the map display, you should see all junction nodes in Zone 1 highlighted in red.
- Now manually remove junction nodes 1, 3, 17, and 87 from the domain. Refer to the map or at the beginning of the fireflow tutorial for the location of these junction nodes.
- Open the the
Domain Manager…
 from the
InfoWater Pro ribbon. The Domain Manager dialog box appears on the screen.
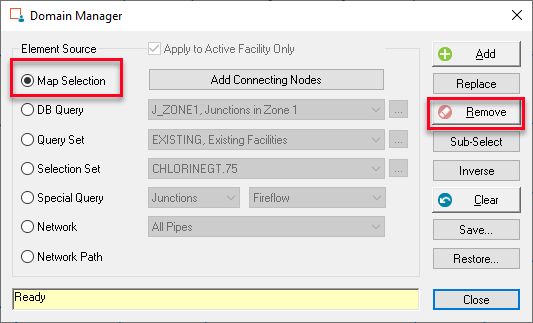
- Choose the Map Selection option in the Element Source area.
- Choose the Remove
 button. You are then prompted to graphically select network components.
- Place the cursor on one of the four junction nodes to be removed and the junction will turn blue (see the screenshot below).
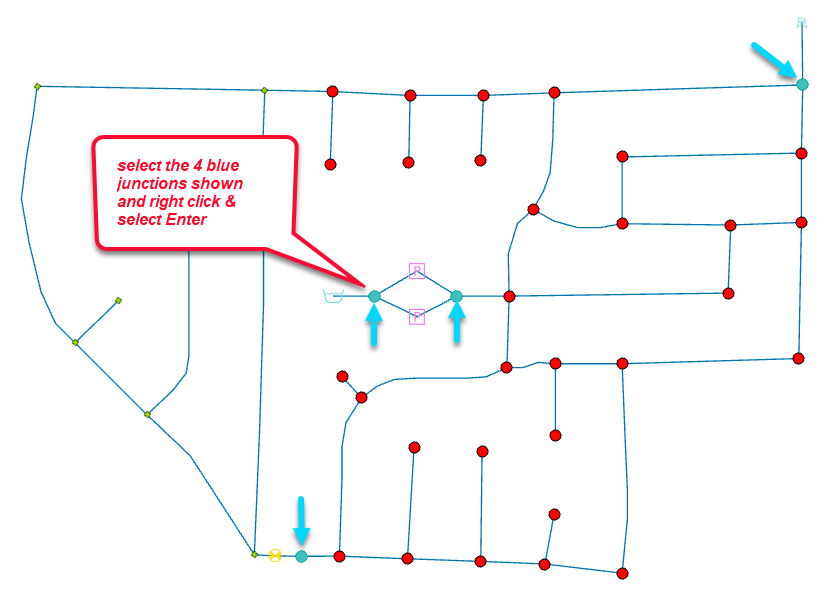
- Repeat the above step for the other three junction nodes.
- Finally, click on the right-mouse button and click on the Enter command. The above listed junction nodes become unhighlighted.
- Open the the
Domain Manager…
- Close the
Domain Manager dialog box. The domain selected remains highlighted. The domain should appear as shown below.
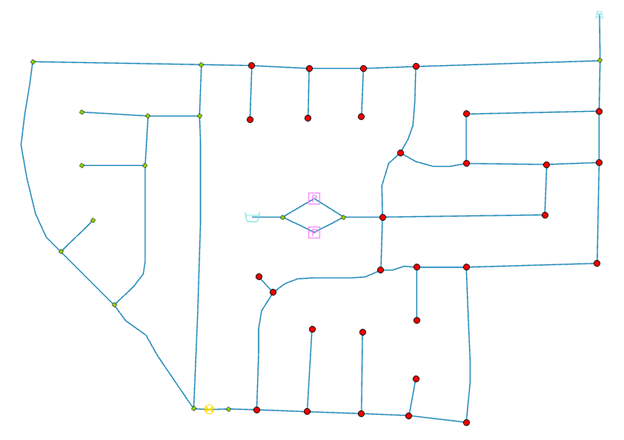
Assign Fireflow Demand
- Click on the
Group Editing on Domain
 icon from the
Edit Group from the InfoWater Pro ribbon. The Group Editing dialog box appears on the screen.
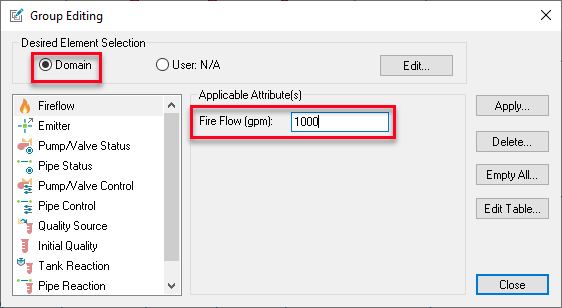
- In the Desired Elements section, select Domain. Choose Fireflow from the column on the left and enter a value of “1000” in the Fireflow field in the Applicable Attributes section to indicate a fireflow demand of 1,000 gpm.
- Click on the
Apply button, click OK in the Confirmation dialog box, and then click on the
Close button to close the Group Editing dialog box. The domain is no longer needed. You may now clear the domain.
Note: To assign a Fireflow demand to a single junction or to verify Fireflow demands were applied, select one of the domain junctions and using the Tools
 button and select the Fireflow item in the list. If defined, the value assigned will have shown up. To change it, change the value and select update, or to remove select Purge to clear all Fireflow demand for this junction.
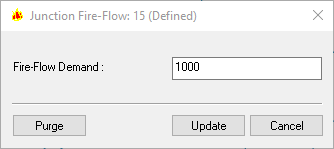
- Click on the InfoWater Pro button. From the Tools menu, choose the Domain Manager… command. The Domain Manager dialog box appears on the screen. Choose the Clear button and then close the Domain Manager dialog box.
Step 2: Perform a Fireflow Analysis
Run a Fireflow Simulation
Fireflow simulations and simulation options are controlled with the Run Manager. Start the Run Manager to run the fireflow simulation.
- Open the Run Manager
by clicking on the
Run
 button from the
Analysis Group of the InfoWater Pro ribbon or by clicking on the
Run
 button from
Model Explorer to open the Run Manager. The Run Manager dialog box appears on the screen.
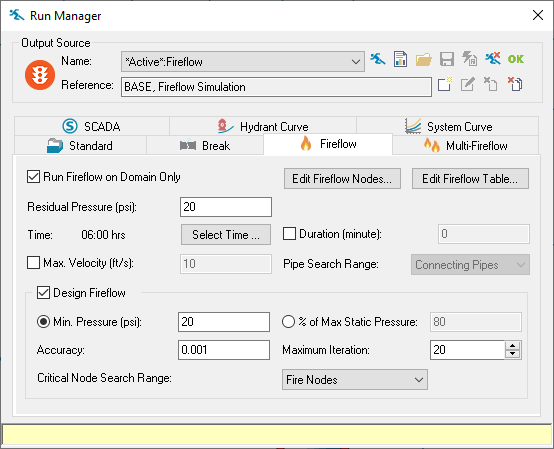
- Choose the Fireflow tab, and set the following fireflow simulation parameters.
- Click on the Run Fireflow on Domain Only checkbox.
- Set Residual Pressure to 20.00 psi; that is, the residual pressure targeted at each junction node in the fireflow set.
- Choose the extended period simulation time period at which fireflows will be calculated. For this tutorial, click on the Select Time button and choose hour “06:00 hrs”.
- Click on the Design Fireflow checkbox.
- Set the Minimum Pressure to 20.00 psi.
- Set the Accuracy to 0.001.
- Set the Minimum Iteration to 20.
- Set the Critical Node Searching Range to Fire Nodes.
The Fireflow tab of the Run Manager dialog box should appear on the screen, as shown below.
-
Click on the Run
 button at the top of the dialog box to run the Fireflow analysis. Once you have completed the Fireflow run, you will notice that it will automatically close the Run Manager as long as results have been found and automatically open the Fireflow report selected based on the run settings used.
Refer to the Analyzing Output Results > Fireflow Run Results topic in InfoWater Pro's online help for more information on fireflow analysis. Here is the link to it: Fireflow Run Results.
Step 3: Review and Analyze Results
InfoWater Pro provides the following model results for each junction node analyzed, all of which are available on the Fireflow and Fireflow Design Reports on the Report Manager.
Note: Output Results can be viewed in the Report Manager. Because the Fireflow run automatically opens the Fireflow report, you may not know how to access this report, if needed in the future. Instructions for how to open up a Fireflow report are included for your reference:
-
You can open up the Report Manager dialog box by clicking on the Report Manager
 button from the
View Group of the InfoWater Pro ribbon. To open a new report, click on the
New
 button to open up a new report.
- When the Output Report/Graph dialog box appears on the screen, click on the
Report button, select the *ACTIVE*:FIREFLOW Output Source from the drop-down menu, choose “Fireflow”, and click on the Open button.
he window as required to see all columns and Review results as shown. A detailed explanation of all of the fields shown in this here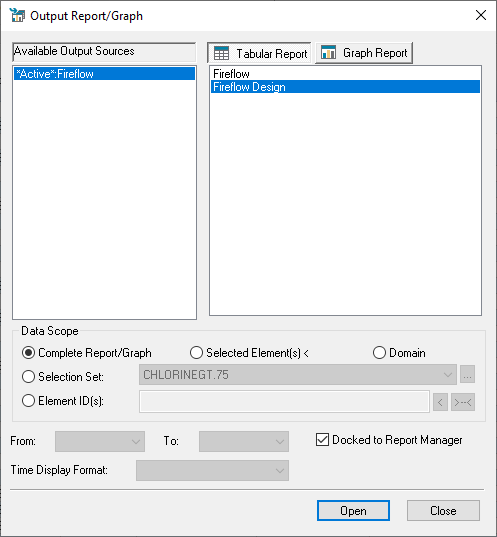
- When the
Fireflow Report appears on the screen, click on the
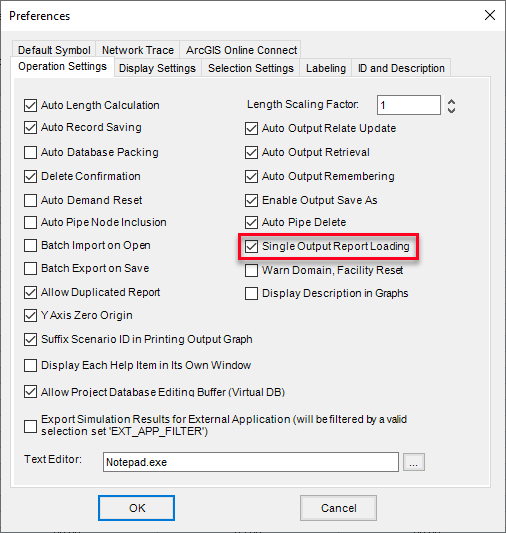
Close button to close the Output Report/Graph dialog box, if necessary.Note: In the Preferences (Project Group on the InfoWater Pro Ribbon) under the Operation Settings tab, the user can verify the Single Output Report Loading box is checked. When checked, the Output Report/Graph window will automatically close when a report or graph is opened. If unchecked, the Output Report/Graph window will remain open until manually closed using the
Close button. Adjust your settings as desired.
- Expand the Fireflow Report so you can see all columns and results, as shown below. Take a moment to review the results shown.
Note: Two key fields are most often used in the Fireflow Standard Report: Residual Pressure and Hydrant Available Flow. If the Residual Pressure is below the Residual Pressure set in the Run Manager, this is often a clear indication the location cannot support the Required Fireflow assigned at this location. The Hydrant Available Flow represents the maximum total demand that can be placed on the Junction being tested that would reduce the pressure at that location to the Residual Pressure set in the Run Manager. A detailed explanation of all of the fields shown in this Fireflow Standard Report can be found here: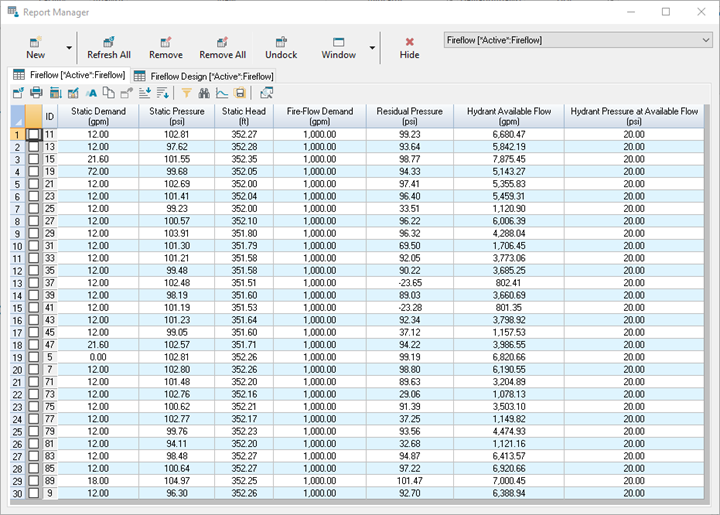
- Residual Pressure - The residual pressure at the current junction which includes both the fireflow demand plus the static demand. This pressure value assumes that only the current hydrant (node) is subjected to the assigned fire demand and that no other fire demands are considered in generating this value.
- Hydrant Available Flow - The maximum flow that is available while maintaining the user-specified minimum residual pressure at the current junction node, assuming that only this hydrant (junction node) is flowing.
InfoWater Pro creates the Fireflow Design Report only if you have checked the Minimum Design Pressure option in the FireFlow tab of the Run Manager dialog box.
- On the Report Manager, click on the New button. When the Output Report / Graph dialog box appears on the screen, click on the Report button, select the *ACTIVE*:FIREFLOW Output Source, choose “Fireflow Design”, and then choose Open button.
- When the Fireflow Design Report appears on the screen, click on the Close button to close the Output Report/Graph dialog box.
- Expand the Fireflow Design Report so you can see all the columns and data results, as shown below. Take a moment to review the results shown.
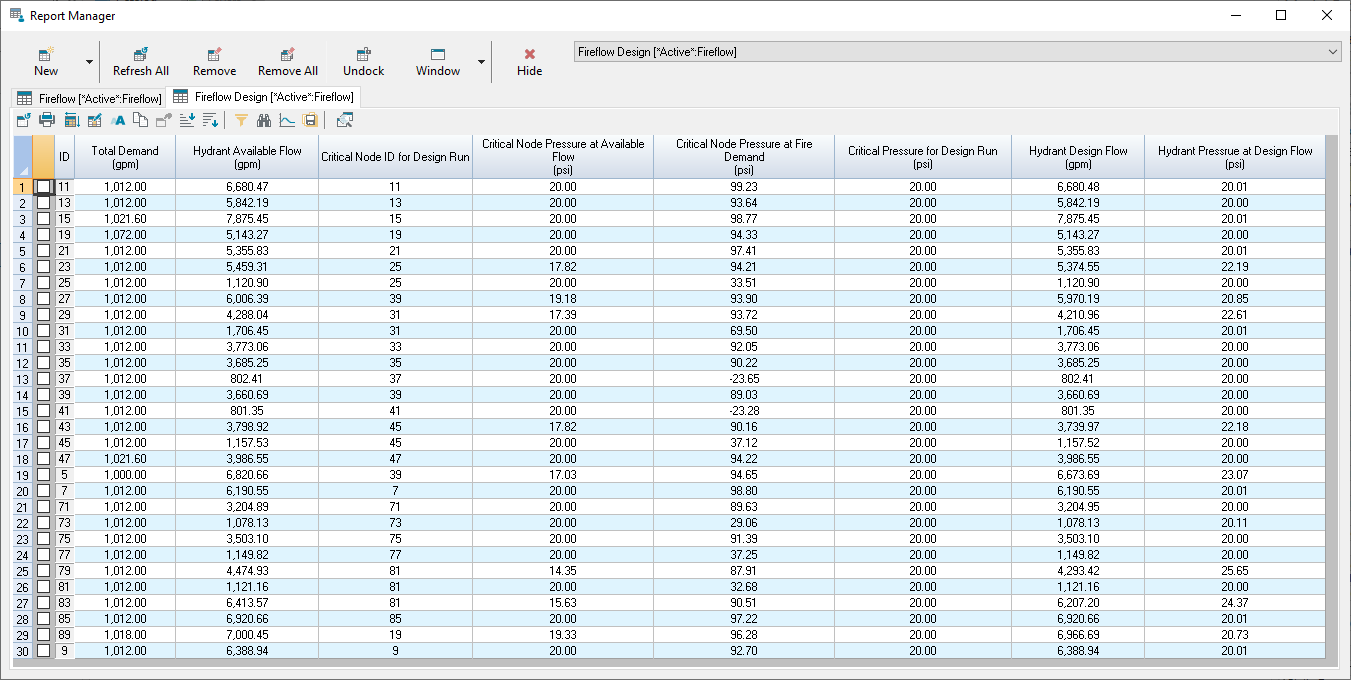
Note: The Fireflow Design Report builds upon the Fireflow Standard report, but includes checks that make sure the Fireflows applied will not cause pressures lower than the specified Min. Pressure specified in the Design Fireflow section of the Run Manager Fireflow tab when the Fireflow run is completed. In essence, if any of the Calculated Available Flow values would result in any location in the specified Design Fireflow search range defined (Fire Nodes, Domain, or Entire Network), then the software iterates to reduce the Fireflow until all locations in the search range meet the specified minimum pressure criteria. The Adjusted Flow is called the Hydrant Design Flow. One other Key field is often helpful here is the Critical Pressure at Fire Demand. This field is the lowest Pressure in the search range when the required Fireflow is applied at the given junction. As a result if your Required Fireflow Demand values are assigned properly any location with this field falling below the specified Min Pressure will indicate this location will generally not be capable of supplied the required Fireflow assigned to it without changes to the system. A detailed explanation of all of the fields shown in this Design Fireflow Report can be found here:
- Critical Node Pressure at Fire Demand - The lowest pressure in the specified search range when the required Fireflow demand is applied to the test junction.
- Hydrant Design Flow - The maximum flow available at the current hydrant (node) such that the pressure anywhere within the critical node searching range (Fire Nodes, Entire Network, or Domain) does not drop below the minimum design pressure specified. Based on the critical nodes identified (junction node with minimum pressure in the critical node searching range), InfoWater Pro determines the design flow as the minimum of the adjusted flows for each junction node needed to maintain the minimum design pressure in the entire critical node searching range. Ultimately, the Design Flow as it is the least flow value of all considered residual pressures and velocity constraints. This is the value that an engineer would provide to a local fire department by saying this is the maximum (theoretical) flow possible at the subject junction in order to maintain 20 psi at all times in the distribution system.
Use any of the query and review tools (such as Filter and Sort) on the Report Manager to analyze your fireflow results. Refer to the help topic on Report Manager for more information on using the Report Manager.
You may also use the Map Display to display fireflow simulation results on the map.
Step 4: Sort and Filter Design Fireflow Results
- Sort the Design Fireflow Results by the Critical Node Pressure at Fire Demand field from Low to High. Select the column and click on the
Sort Ascending
 command.
-
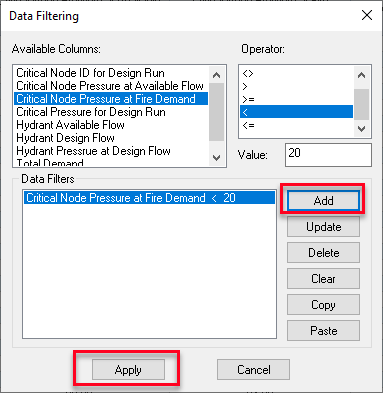
Filter the results to select locations where the Critical Node Pressure at Fire Demand is less than 20 psi. Select the Filtering
 icon. Select the following options, as shown below. Click on the
Add button, and then click on the
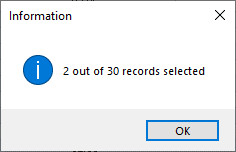
Apply button. Note there are 2 records selected. Click on the
OK button to return to the results.
- Save the Selected records as a selection set. Click on the
Save
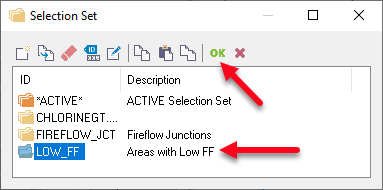
 button to open the Selection Set pop-up window. Select
New
 to create a new Selection set called, “LOW_FF, Areas with Low FF”.

With the new selection set, selected in Blue as shown below, select the green
 button to save the selected elements in the selected Selection set. (Note: Whichever selection set is highlighted in blue when you click on the green
 button will get overwritten, so make sure to select the correct Selection set.)
Note: There are two locations that have pressures that fall below the specified 20 psi Min. Pressure in the Design Fireflow section. Note that they also both have Hydrant Design Flow values that are less than the 1000 gpm Fireflow. This indicates how this field can be used to help identify locations that are unable to satisfy the required specified Fireflow with the system as defined and need further review.
- Click on the
Domain Manager
 button to open it.
- Save the current Domain used for Fireflow as a selection set. Click on the
Save
 button. Click New
 to create a new Selection set called “FIREFLOW_JCT, Fireflow Junctions”.

With this new Selection set highlighted, select the green
 button to save the current Domain as a selection set. This will make it easy to reselect these locations as needed for further fireflow runs.
- Click on the
Clear
 button to clear the Domain.
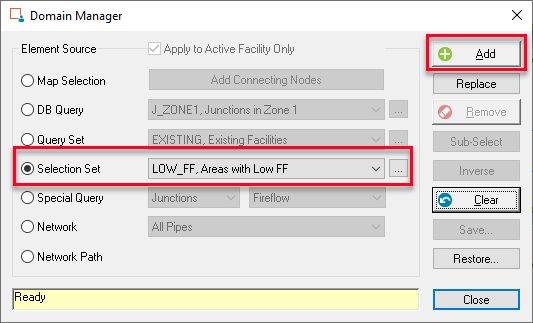
- Select the
Selection Set
radio button and choose the LOW_FF selection set from the drop-down menu list. Click on the
Add
 button to add these locations to the domain. Click on the
Close
 button to close the Domain Manager.
Once you have completed the procedure, you should be able to view the following two junctions in the domain.
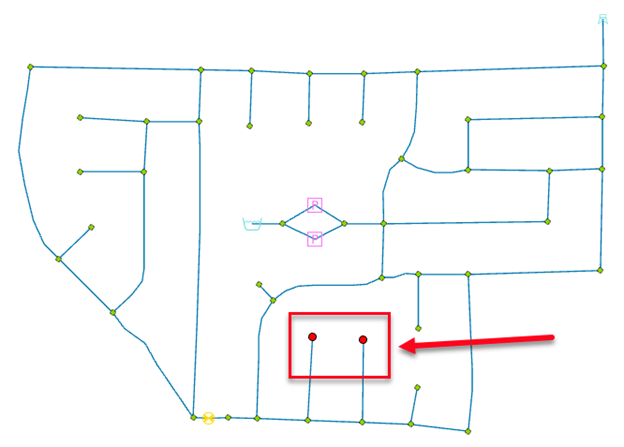
Click on the pipes connected to each location with a fireflow issue. Take a minute to think what is the reason these two locations are unable to meet the 1,000 gpm fireflow? If it is not clear, then follow the steps in next section.
Step 5: Run a Multi-Fireflow Command
The Multi-Fireflow tool can be used in different ways. Most use of this tool is used to apply concurrent Fireflow demands to multiple locations near each other to spread the Fireflow demand between multiple areas. To learn more about the Multi-Fireflow tool, please click here.
Another use of this tool is to use it to review locations with identified low fireflow to find which pipes are likely causing high headloss. We will now run a Multi-Fireflow command on one of the junctions alone and use the Map Display tool to identify pipelines with high velocities and high headloss when the fire demand is occurring.
- Open the Run Manager by selecting the
Run Manager
 button from the Run Manager dialog box. Select the
Multi-Fireflow
 tab.
tab.
- Select the
Select Time
 button and move the slider to select hour 6:00 ,and click
OK to match the analysis hour used for the regular Fireflow runs.
- Click on the Add Junctions
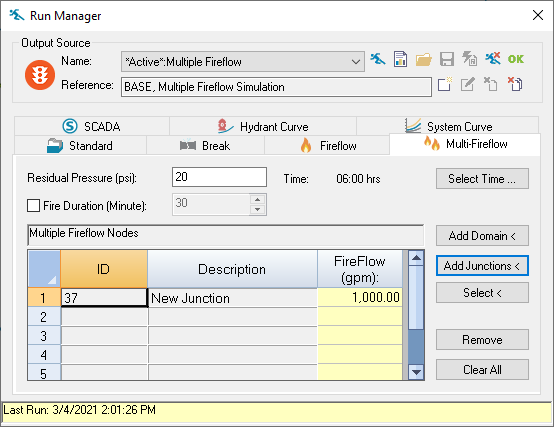
 button and select one of the two nodes in the current domain. It is often easier to draw a box around the junction than to select it. Once the junction is highlighted, right click and select “ENTER” to complete. The table will now populate the node selected and its required Fireflow value, as shown below:
- When the single junction is selected, click on the
Run Manager
 button to run the model. Select the
Yes option when asked if you wish to switch to the latest Output. The Run Manager will close and the Multiple-Fireflow report will open up. Because we will not use this report at this time go ahead and use the
Hide
 button to close the Report Manger.
- On the Model Explorer, adjust the time slider to show results at hour 6:00 as this was the hour at which the fireflow is applied. Note the Output should also show as *Active*: Multiple Fireflow. If not, please select that output source before proceeding.

- Click on the
Map Display
 button from the
View Group in the InfoWater Pro ribbon to open the Map Display window.
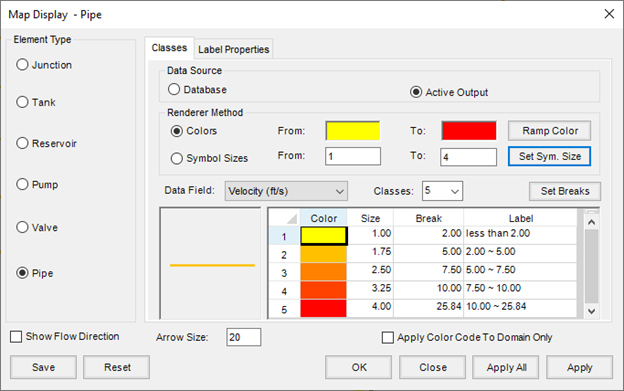
- Select the following options:
- Pipe for the Element Type.
- Active Output.
- Data Field: Velocity.
- 5 Data Classes (If not already at 5 then select 5 and click on the
Set Breaks
 button.
- Adjust the breaks for the first 4 options as 2.5, 5, 7.5, and 10.
- Colors – Select the
Ramp Color
 button to ramp from Yellow to Red.
- Symbol Size – Choose from 1 to 4 and select the
Set Sym. Size
 button to ramp the pipe size as the velocity increases.
- Uncheck Show Flow Direction.
- When the values appear as shown, click on the
OK
 button.
- When applied you can visualize which pipes are exceeding 10 ft/s velocity which is often a good rule of thumb for pipes where the headloss may be excessive. Per the Map Display, the pipe connected to the fireflow node has a very high velocity. Select the pipe to see what velocity occurs when the Fireflow of 1000 gpm is applied.
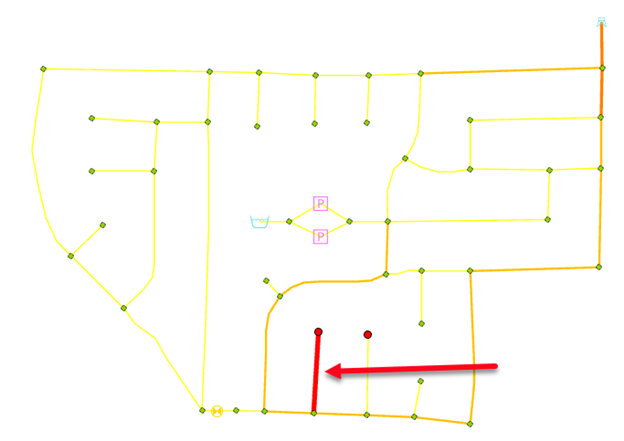
- Select the pipe using the
Select
 button on the Model Explorer to see the output at hour 6:00. It shows that when the 1000 gpm FF is applied the velocity on this pipe exceeds 25 ft/s and results in a headloss of almost 270 ft! Because there are 2.31 ft/psi , this headloss is roughly 117 psi of pressure that is lost in this single pipe alone. This appears to be caused by the undersized pipe which is only a 4-inch line. 10 ft/s in a 4-inch line is roughly 391 gpm which is much less than the required 1000 gpm Fireflow. To keep the pipeline velocity under 10 ft/s and maintain 1000 gpm Fireflow, this pipe would likely need to be upsized to an 8-inch pipe to keep velocities during the fire under 10 ft/s in the main pipe.
- Change the diameter of this pipeline from 4 inches to 8 inches, and reopen the Run Manager to rerun the Multi-Fireflow to see if this resolves the Fireflow issue.
- Once the run is complete, make sure to adjust the output time back to hour 6:00 on the Model Explorer (it defaults back to hour Zero after a run) and the Map Display should automatically update with the new results.
- With this change the headloss is reduced to under 10 ft and the Fireflow node now has a pressure at the required Fireflow that is easily greater than the 20 psi minimum, which would resolve the fireflow issue identified.
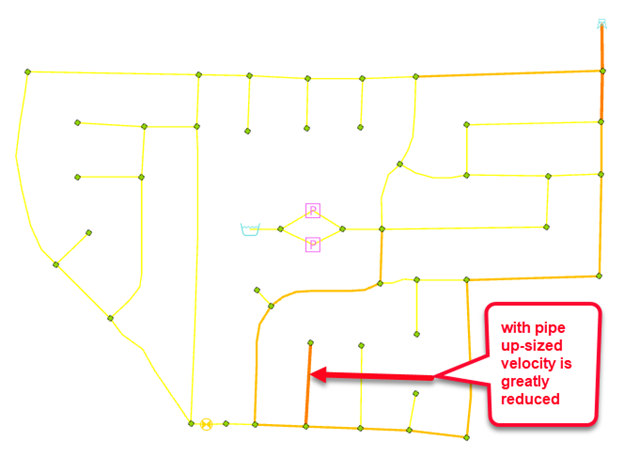
- The other location appears to have exactly the same issue and would likely need the same pipe upsize to resolve. Repeat the steps to resolve for this location as well.
- Once satisfied all issues are resolved, clear the Map display by clicking on the
Reset Display
 button from the
Domain Group of the InfoWater Pro ribbon.
- If desired, rerun the regular Fireflow run (see Step 2 above). NOTE: Make sure to open the
Domain Manager, clear the
Domain, and add the
Selection Set Shown to get the Fireflow Nodes in the domain again.
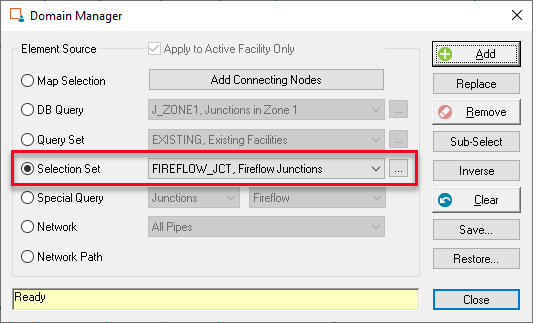
- With the two changes made, now all fire nodes should have Critical Node Pressure at Fire Demand values greater than the specified 20 psi minimum and it should have resolves the issues identified.