Edit, Duplicate, Delete, Export, and Export an Analysis in Insight Builder
Insight Builder allows you to edit, duplicate, delete, filter, and export an analysis.
Sections on this page:
Edit an Existing Analysis
Follow these steps to access and edit an analysis:
In Insight Builder, click Analyses from the left navigation.
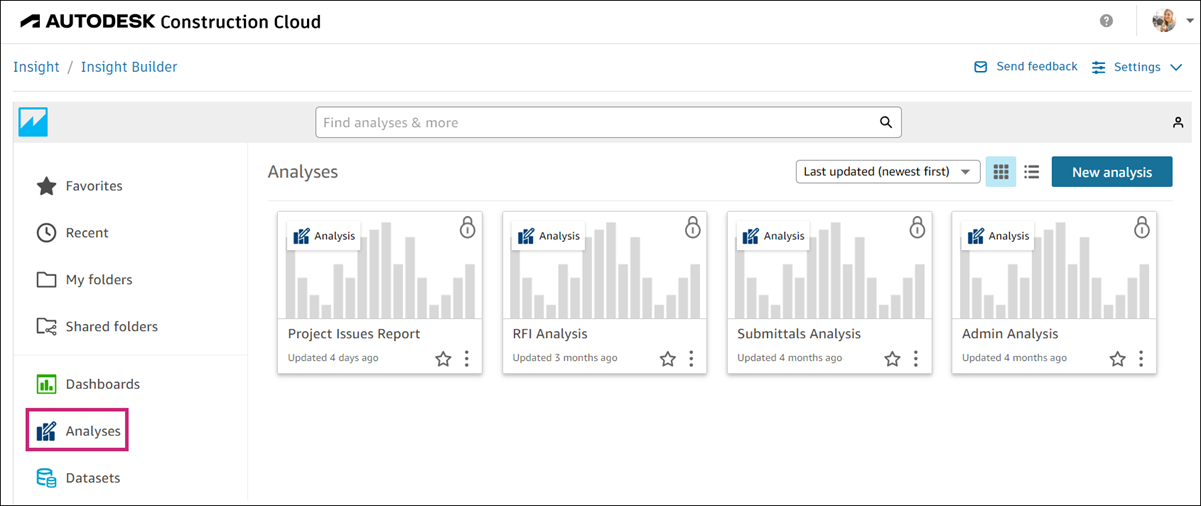
On the Analyses page, click the analysis that you want to edit.
Add a Title to an Analysis
You can add a title and description to your analysis to provide context about the information included in it.
To add a title to your analysis:
On the Analyses page, click the relevant analysis.
Click the existing name of your analysis in the upper left corner of the page.
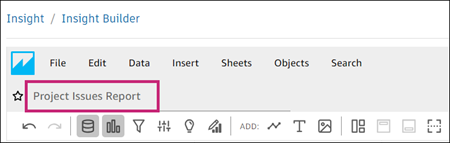
Enter a new title.
View Analysis Details
Navigate to the desired analysis on the Analyses page of Insight Builder. Click this analysis to view its details and edit it as needed.
Use analysis menu:
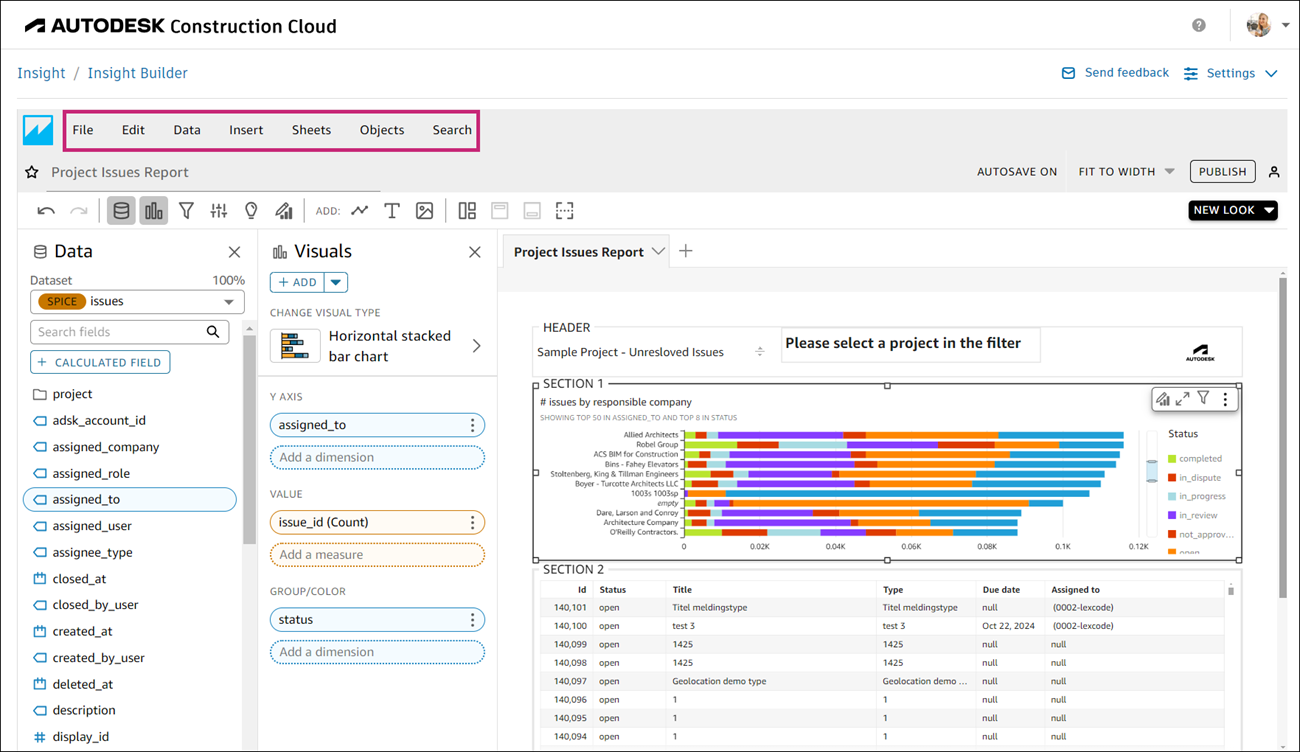
The menu in the top left corner of the page includes the following options:
- File: Use if you want to publish, save, share, rename, print, export, and add your analysis to favorites. The changes you make apply to all sheets or visuals in an analysis.
- Edit: Use to undo and redo the applied changes and access themes and analysis settings. Learn more about themes.
- Data: Use to add and manage data sets, add calculated fields, add parameters, and access parameter settings. The changes you make are applied to all sheets in the analysis.
- Insert: Use to add sheets, visuals, text boxes, insights, calculated fields, filters, and parameters to the analysis.
- Sheets: Use to add, duplicate, and rename sheets, add titles, descriptions, and access and configure layout settings.
- Objects: Use to format objects, add titles, subtitles, data labels, legends, and configure tooltips, and export visuals to CSV or Excel.
- Search: Use to search for a name or a phrase associated with the asset you’re trying to find.
Export Analysis Data
You can export an analysis to PDF or CSV.
Export to PDF
To export an analysis to a PDF file:
On the Analyses page, click the desired analysis.
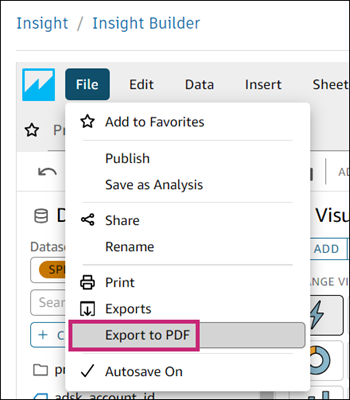
From the top menu, choose File > Export to PDF.
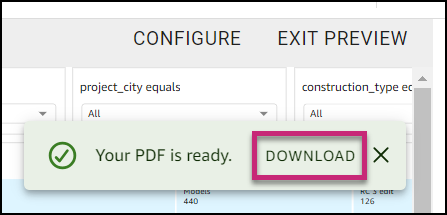
In the message that displays on the right of the page, click Download to access your exported data.
Export to CSV
Click the More menu
 at the top right of an analysis that you want to export.
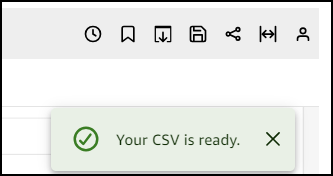
Click Export to CSV.
The following message is displayed when the file is ready for download.
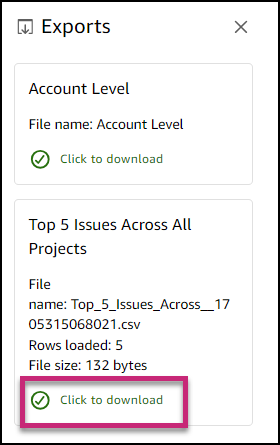
Go to File > Exports to download the file.
Delete an Analysis
Deleting an analysis doesn’t affect any of the dashboards used in this analysis.
To delete an analysis:
- On the Analyses page, click the More menu in the bottom right corner of the analysis that you want to delete.
- Click Delete.
- Click Delete to confirm the action.
Add Visuals to View Visual Data
Add visuals to present your data in a visually appealing way. You can choose from various tools such as bar charts, pie charts, scatter plots, and others.
On the Analyses page, click an analysis to which you'd like to add visuals.
Click the Visualize icon
 in the toolbar at the top left to open the Visuals panel.
 Click the visual that you want to add.
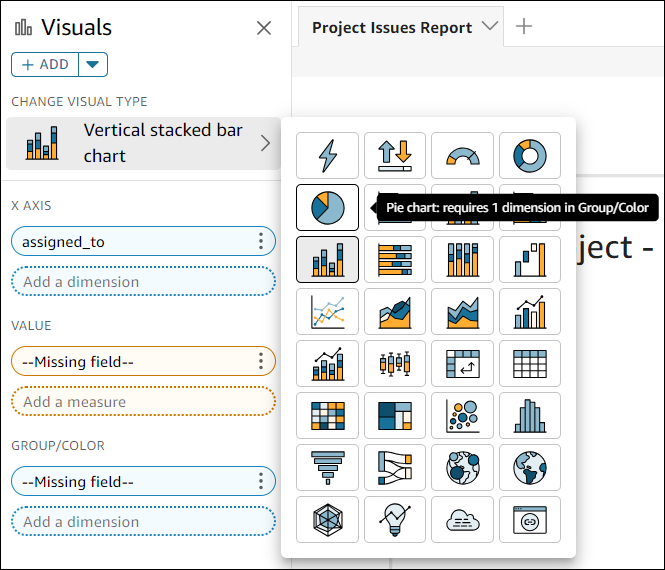 Tip: Hover over each visual type to view its details.
Configure the visual settings and interactions as needed in the Properties panel on the right.

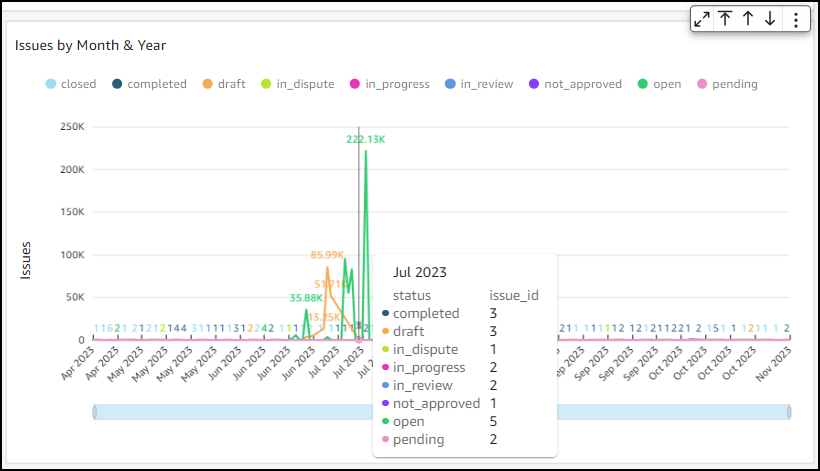
View Visual Data
Data in Insight Builder may be represented in different forms, depending on the type of visual used. Some visuals have axes or rows while others have labels.
To view data presented in a visual, hover over a visual’s graphical element, as shown below.
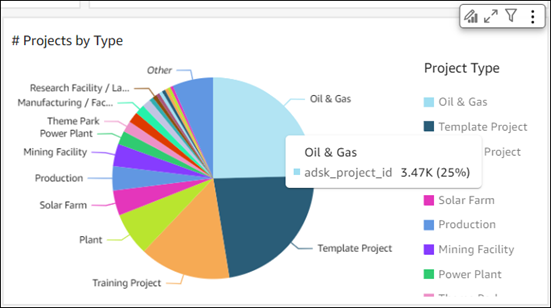
Hovering your cursor over a single data point in a scatter plot displays a pop-up containing information about this data point.
Work with Data Sets
Use the Datasets icon ![]() in the toolbar at the top left of the page to change, add, and configure data sets.
in the toolbar at the top left of the page to change, add, and configure data sets.
Use the Data set drop-down list to add a desired data set and manage data sets.
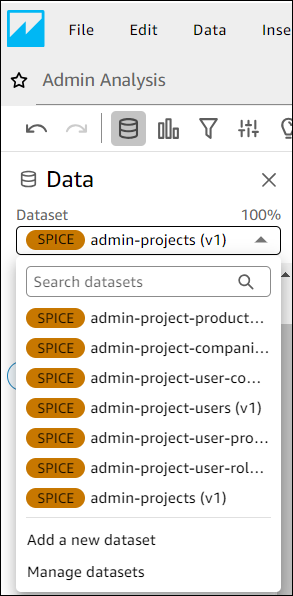
Click Add a new data set at the bottom of the drop-down list to add a data set from outside the list.
Click Manage datasets to view, replace, and remove datasets in the analysis.
Click
 below the dataset drop-down list to transform your data using fields that contain data, parameters, and functions. See Adding calculated fields for more information.
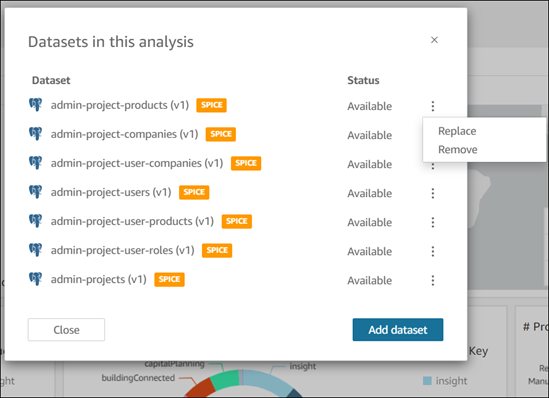
Learn more about data sets.
Filter Analysis Data
Use the Filter icon  in the toolbar at the top left of the page to narrow down the data in your analysis.
Filter considerations:
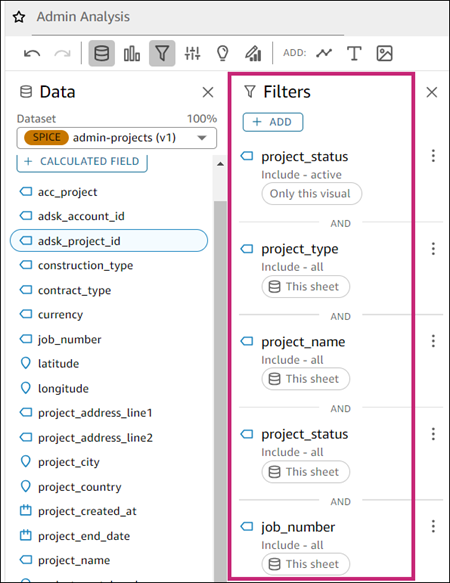
In the Filters panel:
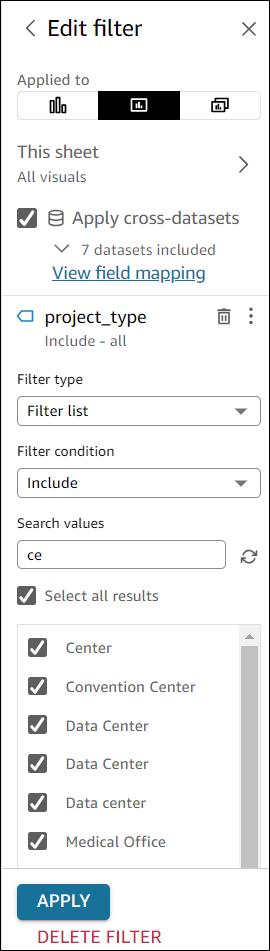
Click the filter of your choosing to select a desired type and filter condition, and select relevant values. When done, click Apply.
Use the More menu
on the right of each available filter to:- Disable
- Set filter position
- Delete filter
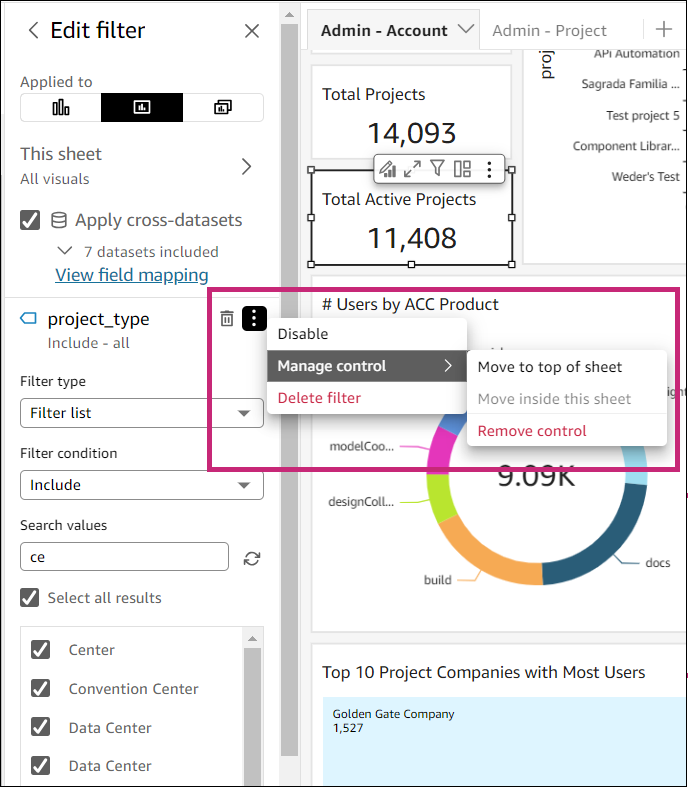
Click the trash bin icon
 to delete a filter
Learn more about filtering data.
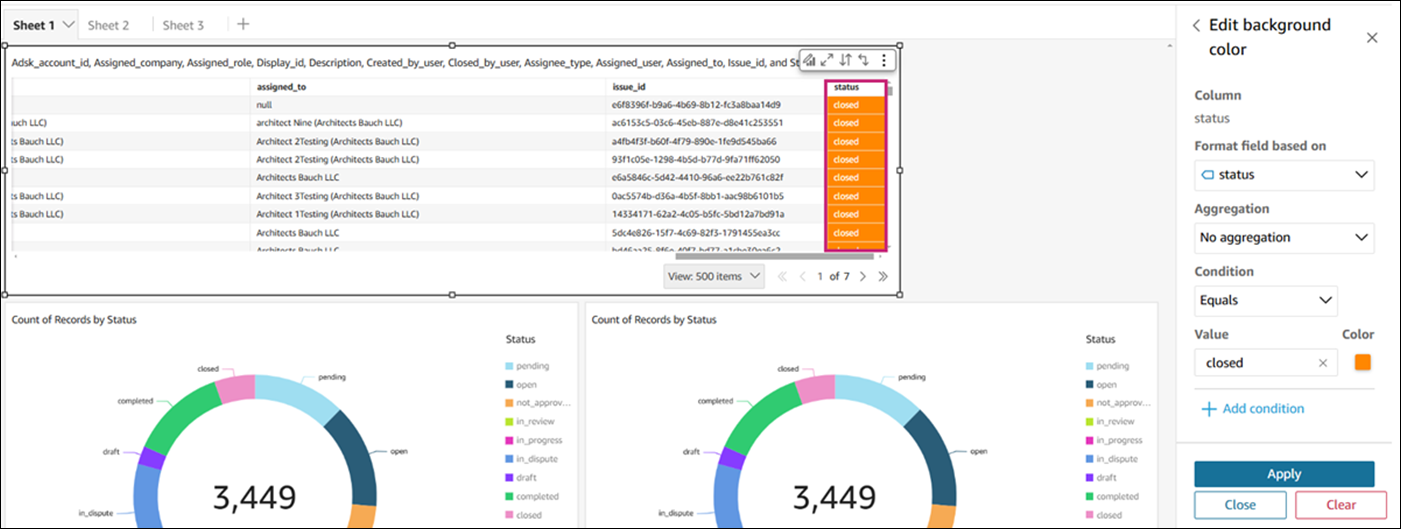
Apply Conditional Formatting
Click Analyses from the left navigation in Insight Builder.
Click the visual that you want to format.
In the toolbar at the top left select Objects > Conditional Formatting.
Depending on the type of visual, you'll be prompted to choose a feature that you want to use.
Note: Not all options are available for all visuals.
Example
When you choose a table visual, you'll be prompted to:
Select a column
Specify conditions:
- Add background color
- Add text color
- Add icon
Select aggregation
Select condition
Enter a desired value
If needed, add more conditions
Click Apply