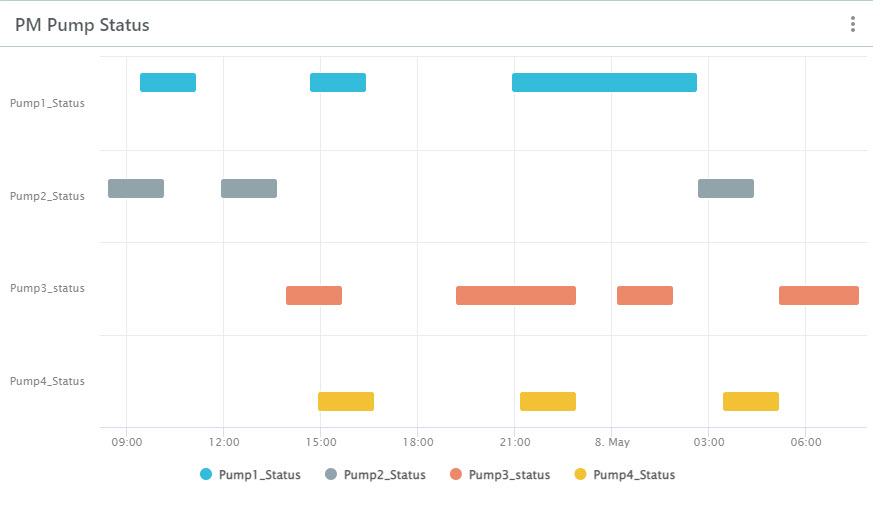
Add a Pump Status Chart to see the statuses of a group of sensors in a specific time interval (e.g., last 24 hours).
To add a Pump Status Chart:
- In your workspace, choose Add Component
 Pump Status Chart.
- Choose a Sensor Group. See how to
create sensor groups.
Note: Only Status and Setting sensor groups can be used in a Pump Status Chart.
- Enter a name and description for your chart.
- Time Range: If you want to show data for a specific time period in your chart, turn this on and then select the specific dates or how many days to go back (time offset).
- Click Submit.