• Help Home
    • What's New
      • What's New in Info360 Insight
        • Map
        • Workspaces
          • Pin Workspace as Pump Station Dashboard
          • Make a Workspace Public or Private
          • Use Simulation Results in Workspaces
          • Enhanced Pump Performance Charts
          • Comparison Table
          • Scatter Chart
          • Workspace Templates
          • Add Quick Access Links to Workspaces
          • Overlay Different Sensor Intervals in a Historical Chart
          • Automatic Refresh for Workspace Data
          • Full Data Sets in Charts
          • Add Pump Status Filters
          • Set your Favorite Workspaces
        • Tools
        • Data
        • Sensors
        • Admin
        • Previous Years
    • Getting Started
    • User's Guide
    • Installation and Setup Guide
    Share
    • Email
    • Facebook
    • Twitter
    • LinkedIn


    Add Pump Status Filters (What's New)

    July 23 | Use pump status filters to isolate readings for a specific pump and compare these to the pump's manufacturer curve.

    This is useful for pump stations with multiple pumps but only one flow and pressure sensor.

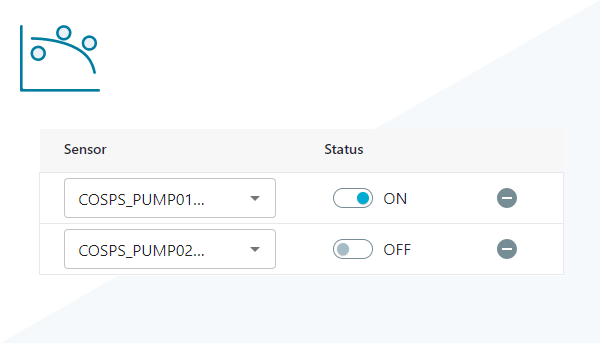
    See Create a Pump Performance Chart for how to add these filters.

    Parent topic: What's New in Info360 Insight

    Was this information helpful?

    Except where otherwise noted, this work is licensed under a Creative Commons Attribution-NonCommercial-ShareAlike 3.0 Unported License. Please see the Autodesk Creative Commons FAQ for more information.

    • Privacy Statement
    • Legal Notices & Trademarks
    • Report Noncompliance
    • © 2025 Autodesk Inc. All rights reserved