
On the Pump Stations tab, you may have the default Pump Station Overview, or you may have a workspace pinned as your pump station dashboard.
Pump Station Overview
The Pump Station Overview gives a 24-hour view of your pump stations' volume and runtime. It updates every hour on the hour.
Totals
Total volume: The total amount of water that has been pumped in the last 24 hours. This is a sum of the calculated volume for each pump station.
Total runtime: The cumulative amount of pump runtime in the last 24 hours. This is a sum of the readings from the pump stations' status sensors for the last 24 hours.
Map
Shows the location of all pump stations on the map.
Pump Stations
Lists all pump stations and their volume (from the calculated volume analytic) and runtime (from the associated status sensors) for the last 24 hours.
The graphs show the same data for the top 10 pump stations.
Workspace as pump station dashboard
Instead of the default pump station overview, a workspace may be set up and pinned as the pump station dashboard. In this case, you will see the customized data in that workspace.
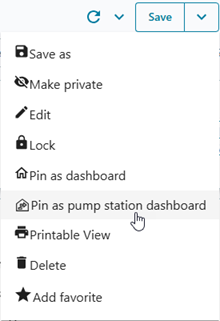
To pin a workspace as the pump station dashboard
- Go to Workspaces and open the workspace.
- Click the drop-down arrow beside Save and select Pin as Pump Station Dashboard.
Note: The workspace must be public.
- Click Confirm.
It is only possible to set one workspace as the pump station dashboard and this is applied for everyone.
You can unpin the workspace at any time to revert to the default pump station overview.