
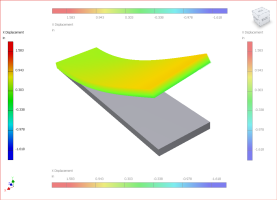
After you run a simulation, in the graphics area a volume plot displays with a color bar that shows the value ranges of the variable.
Set the color bar display
The color bar shows you how the contour colors correspond to the stress values or displacements calculated in the solution. The bar range is set to Automatic as the default. Inventor assigns the value range for display. Color bar display modifications are session-based and do not persist between sessions
- On the Stress Analysis tab
 Display panel, click Color Bar
  .
. - Select your color bar settings.
- In Color Type, select either:
 Sets the bar scale to display with colors
  .
.  Sets the bar scale to display as monochromatic or grayscale
  .
. - Select the options to position and size the color bar.
In most cases, results that display in red represent high stress or high deformation, or a low factor of safety. Each results set gives you different information about the effect of the load on your part.
- Von Mises Stress
- Results use color contours to indicate the stresses calculated during the solution.
- 1st Principal Stress
- Indicates the value of stress that is normal to the plane in which the shear stress is zero. Verifies the maximum tensile stress induced in the part due to the loading conditions.
- 3rd Principal Stress
- Acts normal to the plane in which shear stress is zero. Verifies the maximum compressive stress induced in the part due to the loading conditions
- Displacement
- Results show you the deformed shape of your model after the solution. Indicates the magnitude of deformation from the original shape.
- Safety factor
- Indicates the areas of the model that are likely to fail under load.
- Stress folder
- Contains normal and shear stress results for your simulation.
- Displacement folder
- Contains normal and shear stress results for your simulation. Note: For modal analyses, the displacement results are modal deformations. The displacement magnitude is relative and cannot be taken as actual deformation.
- Strain folder
- Contains strain results for your simulation.
- Contact pressure folder
- Contains contact pressure results for your simulation. Contact pressure is the pressure at contact interfaces. Includes contact pressure components and the resultant value.
- Modal frequency folder
- You can view the mode plots for the number of natural frequencies that you specified in the solution. The modal results appear under the Results node in the browser. When you double-click a frequency mode, the mode shape displays. The color contours show you the magnitude of deformation from the original shape. These deformations are modal, and their magnitude is relative and cannot be taken as the actual deformation. The frequency of the mode shows in the legend. It is also available as a parameter.
View which results are available
- To see the variety of results that you can view, in the browser, expand the Results folder.
Static Analysis type displays the Von Mises Stress plot.
Modal Analysis type displays the frequency mode.
- To view a different result, right-click the browser node corresponding to the results you want to see, and click Activate, or double-click the result node.
- To exit the results display, double-click an active results node.
Display configurations for parametric studies
- Click Parametric Table
 .
. - In the Parametric Table, move the sliders.
- To solve a configuration that is not generated, in the Parametric Table, right-click the parameter row and click Generate Single Configuration, or run the simulation.
Change shaded display of simulation results
- In the Display panel, click Shaded Display.
- On the drop-down list, click:
- Smooth Shading
 Colors blend from one to the next. Default plot presentation for all result types, whether Static or Modal analysis simulation.
 - Contour Shading
 Color separation is clear. Displays the colors using a strict banding method.
 - No Shading

- Smooth Shading
Overlay mesh on volume plot with Mesh View
- At any time, click Mesh View
 .
. - After the mesh is defined, to turn Mesh View on or off, click Mesh View .
Display XY plots
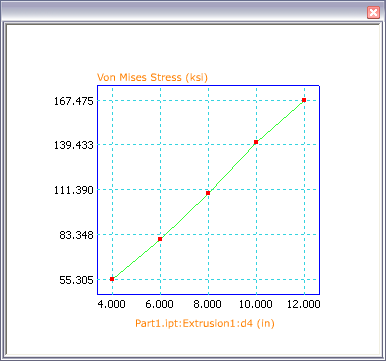
In parametric studies, you can view the results as a two-dimensional XY plot.
- In the browser, select the Results type (Von Mises Stress, Displacement, and so on) that you want to see in a plot.
- Right-click the parameter row, and click XY Plot. A separate window displays the XY Plot.
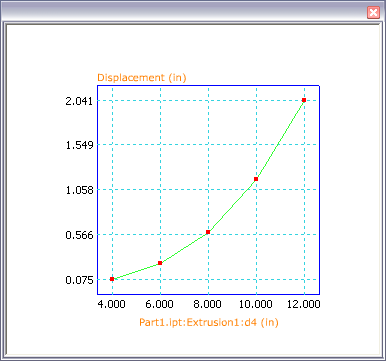
The following image from the same simulation displays the XY Plot for Displacement results rather than Von Mises Stress.
Display convergence plots
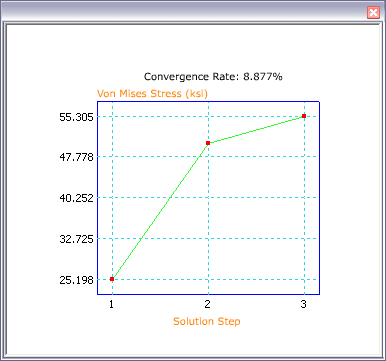
Define the convergence criteria that is used to reach a solution. The resulting convergence plot, shows the number of refinements used and the parameter values associated with each refinement.
To view an XY plot of the result convergence, in the Convergence Settings, set the Maximum Number of h Refinements to greater than zero.
- In the browser, click the node for the Results folder, and click Convergence Plot
 .
. - In the Prepare panel, click Convergence Settings
 .
. - In the Convergence Settings dialog box, specify:
- Maximum Number of h Refinements
- Default is 0. Value increment is 1.
For values higher than 2, a dialog box displays. Increasing the number of refinements could decrease performance.
If the Stop Criteria is met, the refinements can cease before the maximum number is reached.
- Stop Criteria (%)
- Ceases refinement when the difference between the last two results is less than the specified (%) value.
- h Refinement Threshold (0–1)
- 0 means include all the elements in the set as candidates for refinement. The results are the maximum refinement per cycle. One means exclude all elements in the set from refinement, as in no refinement. The default is 0.75, which means, of the elements with equivalent errors at the top, 25% are subject to refinements. Not applicable to Modal analysis.
Value increment is 0.1.
- Results to Converge
-
- Von Mises Stress
- 1st Principal Stress
- 3rd Principal Stress
- Displacement
- Geometry Selections
- Specifies the geometry to consider for the convergence criteria.
- In the Solve panel, click Simulate. Let the simulation complete.
- In the Result panel, click Convergence Plot.
Display deformation plots
Deformation is the amount of stretching that an object undergoes due to the loading. Use the deformation results to determine where and how much a part can bend. Determine how much force makes it bend a particular distance.
Most often, the true geometry deformation is slight in comparison to the overall model size. An automated exaggeration effect illustrates where deformation occurs.
- On the Stress Analysis tab Display panel, click Adjust Displacement Display
 .
. - When the volume plot displays, select one of the display options to exaggerate the deformation:
- Undeformed
- Actual
- Adjusted x0.5
- Adjusted x1
- Adjusted x2
- Adjusted x5
Display Safety Factor results
Factor of safety results immediately points out areas of potential yield. Equivalent stress results show red in the highest area of stress, regardless of how high, or low the value. A factor of safety of 1 means the material is essentially at yield. Most designers strive for a safety factor of between 2–4 based on the highest expected load scenario.
If some areas of the design go into yield it does not always mean part failure, unless the maximum expected load is frequently repeated. Repeated high load can result in a fatigue failure, which is not simulated by Autodesk Inventor Simulation Stress Analysis. Use engineering principles to evaluate the situation.
Animate Results
Create an animation to visualize the part through various stages of deformation. You can also animate stress, safety factor, and deformation under frequencies. Animate the results and observe the displacement or stress buildup over a sequence of images. You specify the number and selection of images, and the animation plays them back in a series. You can record the animation.
- On the Stress Analysis tab Results panel, click Animate Display
 .
. - To record the results animation in AVI format, click Record
 . Specify the file name, and choose a codec from the list.
 - If you do not want the original model to display in wireframe during the animation, clear the Show Original.
- Select the Speed, and specify the number of steps in the playback animation. For smoother transitions between images, increase the number of steps.
Maximum and Minimum Results
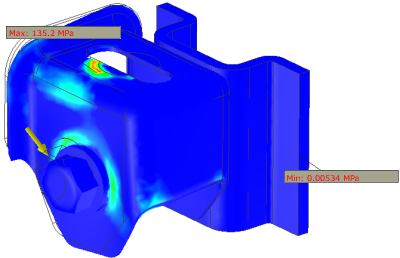
- To display an annotation at the point where either condition occurs, on the Stress Analysis tab Display panel, click Maximum Result
 , or Minimum Result
 .
.
Display or hide probe labels
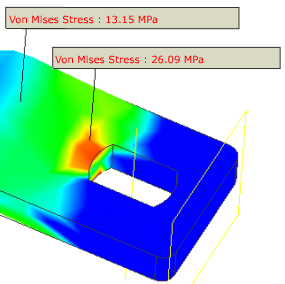
Use Probe ![]() to identify points of interest with a label specifying the result type and value at that point. You can annotate as many points as you want.
to identify points of interest with a label specifying the result type and value at that point. You can annotate as many points as you want.
Use Probe Labels ![]() to turn on and off visibility for the labels.
to turn on and off visibility for the labels.
Display load indicator with Boundary Conditions
To turn on and off the display of the load indicator, which points to where the load is applied, click Boundary Conditions![]() .
.