
Use this dialog to set up a simulation that runs multiple test cases.
To open the dialog for a new configuration, right-click Generalised Multi Run (GMR) Group in the Model Group window and select New  Generalised Multi Run Config.
To open the dialog for an existing configuration, select an item from the Generalised Multi Run Group in the Model Group window.
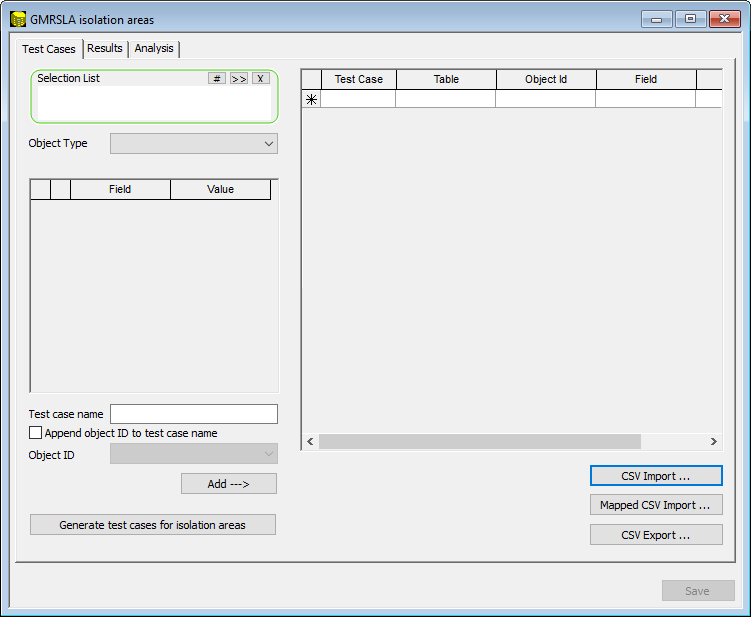
Test Cases page
You use this page to specify test cases in the grid on the right side. You can enter the test cases manually, although a wizard is provided on the left side to make the creation of multiple test cases quicker.
| Item | Description | ||||||||||||||||
|---|---|---|---|---|---|---|---|---|---|---|---|---|---|---|---|---|---|
| Wizard |
The selections you make in the wizard are applied to the test case grid on the right when you click Add. You can change the selections in the wizard then click Add again to create more test cases in the grid.
|
||||||||||||||||
| Test case grid |
You can create test cases directly on this grid, or you can populate the grid using the wizard on the left. Even if you use the wizard, you can change the test case details in the grid, and you can add new test cases manually. You can delete a test case by right-clicking its left-most (grey) column and selecting Delete.
|
||||||||||||||||
| CSV Import | Click this button to import a .csv file containing test case information previously set up. | ||||||||||||||||
| Mapped CSV Import | Click to open the GMR Mapped CSV Import dialog, which is used to set up test cases based on components from a CSV file or SQL results grid. These test cases are transferred to the test case grid, described above. | ||||||||||||||||
| CSV Export | Click this button to create a .csv file containing the current test case configuration. |
Examples of creating Test Cases
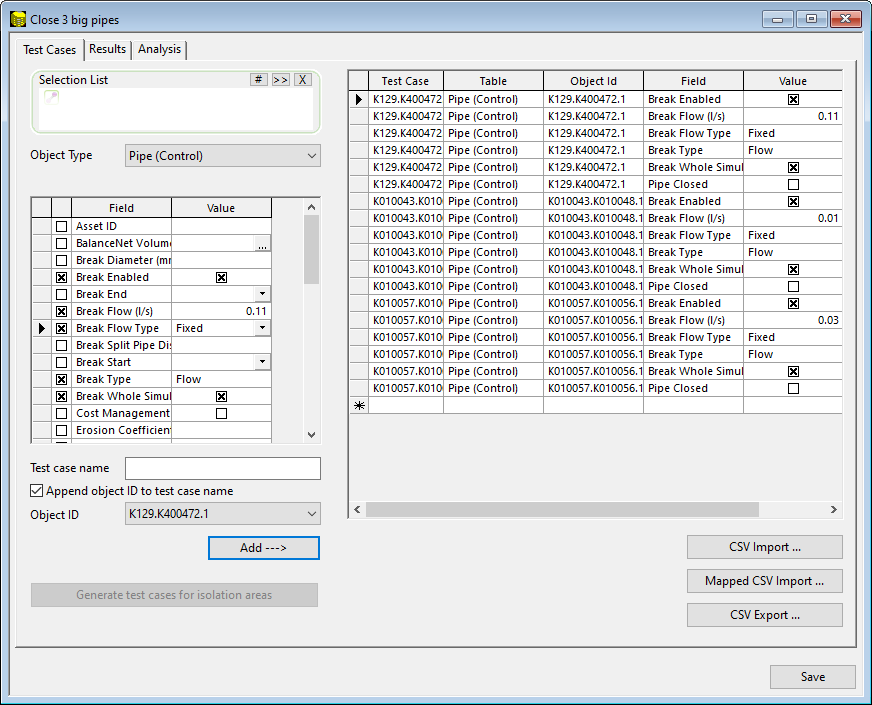
Generalised Multi Run (GMR) is setup by specifying test cases. The following image shows a very simple case. There are three test cases and so there will be three runs. Each run involves closing a single pipe, and the run takes the name of the pipe.
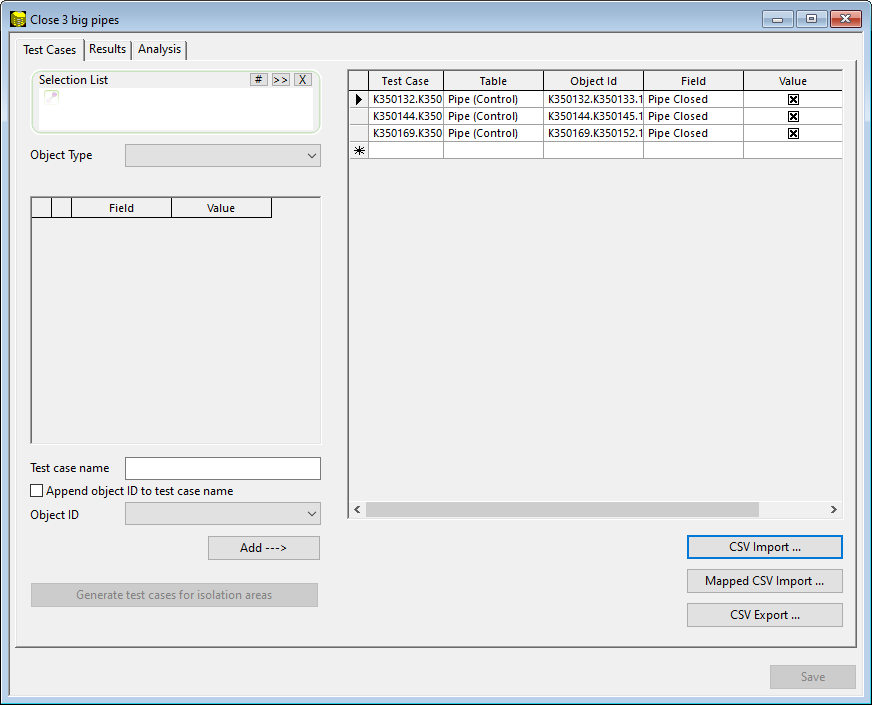
To make this simple list of test cases, use the “wizard” section on the left pane of the dialog.
-
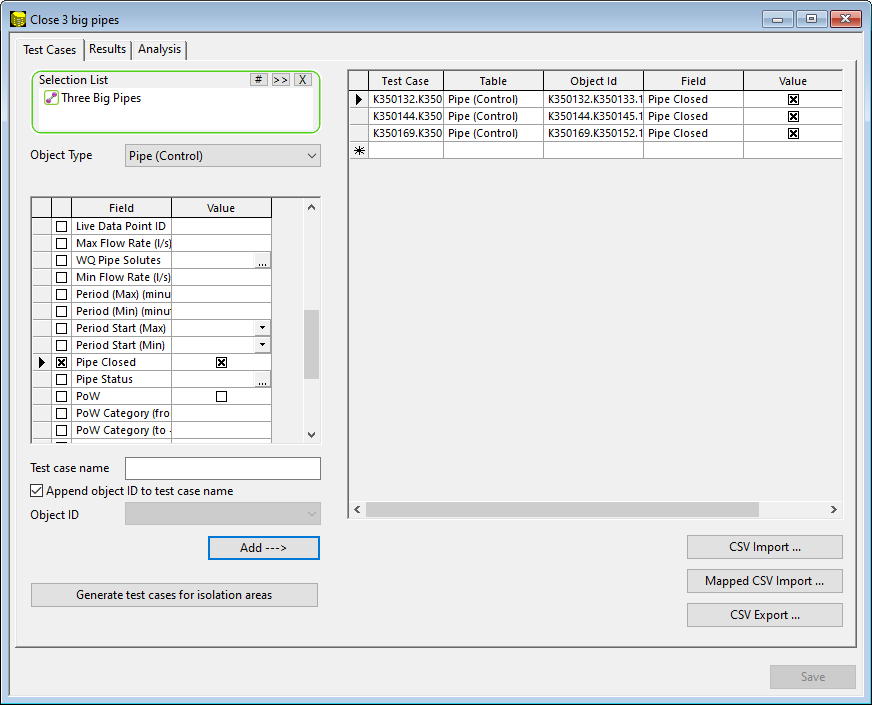
Start with a selection list of three pipes. Drop this into the drop target.
-
From the drop-down menu, select Pipe (Control). This exposes the fields for the pipe control fields.
-
Find Pipe Closed and check the box (i.e., closed).
-
Check the box Append Object ID to Test Case Name. Leave the Test Case Name blank.
-
Click Add - - > . Three test cases are created. Each takes the name of its pipe, and each test case involves closing the pipe.
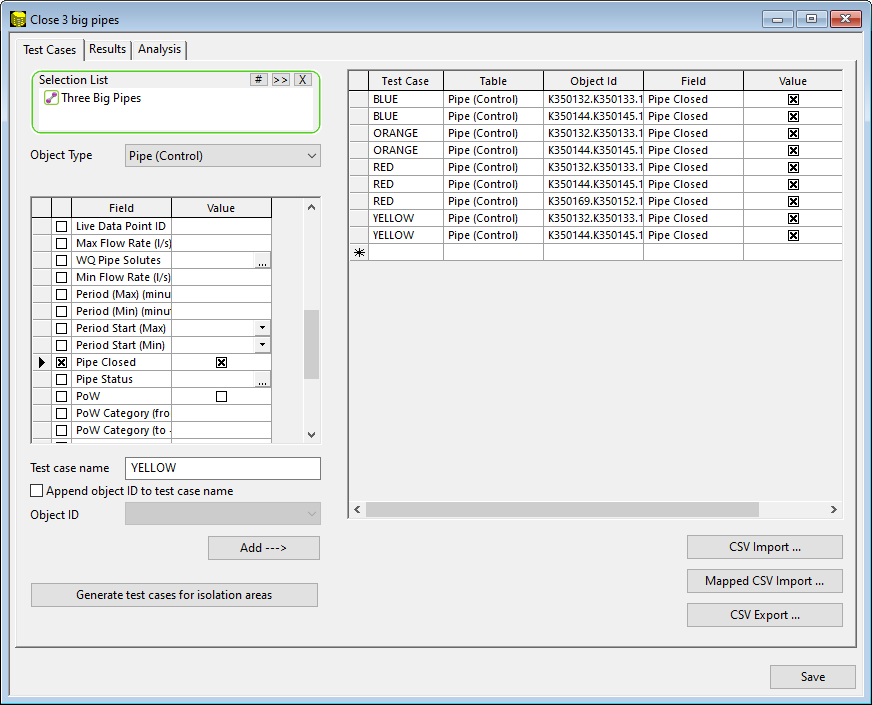
To add multiple objects in one test case:
-
Start with a selection list of three pipes. Drop this into the drop target.
-
From the drop-down menu, select Pipe (Control). This exposes the fields for the pipe control fields.
-
Find Pipe Closed and check the box (i.e., closed).
-
Set the test case name to RED.
-
Click Add - - >.
A single test case is created. The GMR would run single simulation called RED, in which three pipes are closed.
-
Repeat the steps above but with the name YELLOW.
-
Click Add - - >.
-
Delete one of the rows of the YELLOW test case
Now the GMR has two simulations called RED and YELLOW with three and two closures, respectively. Continue in this way to make two further test cases called ORANGE and BLUE.
For the set-up of a more complex GMR. Take the three pipes, and for each pipe, set up a burst. The burst involves setting several Control fields. But go beyond this and set up three different burst sizes.
-
Start with a selection list of three pipes. Drop this into the drop target.
-
From the drop-down menu, select Pipe (Control). This exposes the fields for the pipe control fields.
-
Set the burst fields: enable the burst; for the entire simulation; a flow type burst; a fixed flow; a flow value of 0.5 l/s. So, there are five Control fields.
-
For test case, give the name SmallLeak and check the box Append Object ID to Test Case Name.
-
Click Add - - >.
-
Modify the leak value to 1.0 l/s and change the name to MediumLeak. Click Add - ->.
In this way you have multiple tests cases for each object. And each test case involves the setting of multiple fields.
As can be seen, the wizard offers a lot of flexibility. In addition, you can export the test cases to CSV, manipulate them and reimport them. For even greater power, you can use SQL to generate a table which is imported into the test case grid. See GMR Mapped CSV Import dialog for more information.
Results page
You can use this page to specify a subset of results to keep. You might want to do this to save storage space.
Click to see page properties
| Item | Description | ||||
|---|---|---|---|---|---|
|
Test cases |
|
||||
| TVD results |
You can choose to discard all time variable results, perhaps because you do not want them to take up storage space. You can choose to keep or discard certain combinations of results and summaries, perhaps because you want to conserve storage space. |
Examples of Results handling in GMR
The minimum for the retention of results is to keep the summary data cube, Keep Summary Report Only. This allows the generation of grid reports, as well as thematic colouration in the GeoPlan. This summary report is always retained
At the other extreme, Keep All TVD Results allows individual simulations to be examined but of course the volume of data may cause performance and storage problems.
Intermediate approaches are:
-
Keep individual test cases if a query returns a “positive”. For example, you might have a query to select a reservoir if its level drops below 20% full. Any test case that includes results like this will be retained.
-
Keep summaries for individual test cases, but discard time varying results.
Analysis page
You can use this page to specify analysis options.
| Item | Description | ||||||||
|---|---|---|---|---|---|---|---|---|---|
|
Analysis |
|
||||||||
| Results query |
Available only if the Analysis option is set to Use Stored Query.
|
||||||||
| Simulation results fields |
Available only if the Analysis option is set to Use Simulation Result Fields.
|
||||||||
| Perform base simulation | A base simulation is one without any of the changes specified in this configuration. Tick the box to run a base simulation in addition to the simulations you have set up on the Test Cases page. You might want to do this so that you can compare "before and after" values. | ||||||||
| Perform Service Level Analysis |
This option allows you to perform Service Level Analysis. By default, this option is not selected. Clicking the Options button opens the Critical Link Analysis Options dialog where you can set up your options for analysis criteria, minimum and maximum pressure, event demand efficiency, and failure count type during a critical link analysis simulation. |
Examples of the Analysis of GMR results
The Analysis tab decides what values go into the summary table. The summary table is structured as follows:
|
Test Case name |
Object ID name | Result 1 | Result 2 | Result 3 | Result 4 | Result N |
The Test Case and Object ID fields will form a primary key within the summary table.
As an example, if using a query to populate the report, Result-1 could be pressure at time T1, Result-2 could be pressure at time T2 and Result-3 might be Max Pressure. This table will be “sliced and diced” for final display in the grid or GeoPlan. Aggregation will take place across Object ID or Test case name to give minima to Result-1 or maxima for Result-3.
The summary table is constructed from pre-existing summary fields or from a query.
-
Pre-existing summary fields: Use a selection list or use the list of test case objects. Choose some summary result fields; these will appear in the summary table.
-
Run a query: For this you can also request that a Base Run is used (i.e., the original run with no test case instructions) and both Test Case and Base Run would be available in the query.
An example of a query is seen below. It is designed for pipes. The query returns an object id (as the result column object_id) and a result column called SeriousReversal, which will be 0 or 1 if there is a large number of flow reversals. Test case ID is automatically output.
select OID AS object_id , IIF( (sim.pctflowf > 20 and sim.pctflowf < 80 and sim.vnegmax < -0.15 and sim.vposmax > 0.15 and sim.reversal > 10),1,0) AS SeriousResersval
The summary table will contain three columns: test_case, object_id, SeriousReveral
Save button
Click to save the configuration.