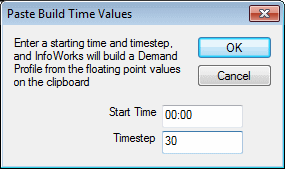
This dialog is shown when you right click in the Time column of the Daily Values Grid in the Demand Diagram Editor.
Put in a start time and timestep (minutes) and InfoWorks WS will build a grid of time/value pairs from a list of floating point values on the clipboard. It will stop as soon as it finds data that is not numeric.
Show image

