To open the
Analytics Object window
- From the Evaluation Toolkit Debugging Section, click the Launch Analytics window
The
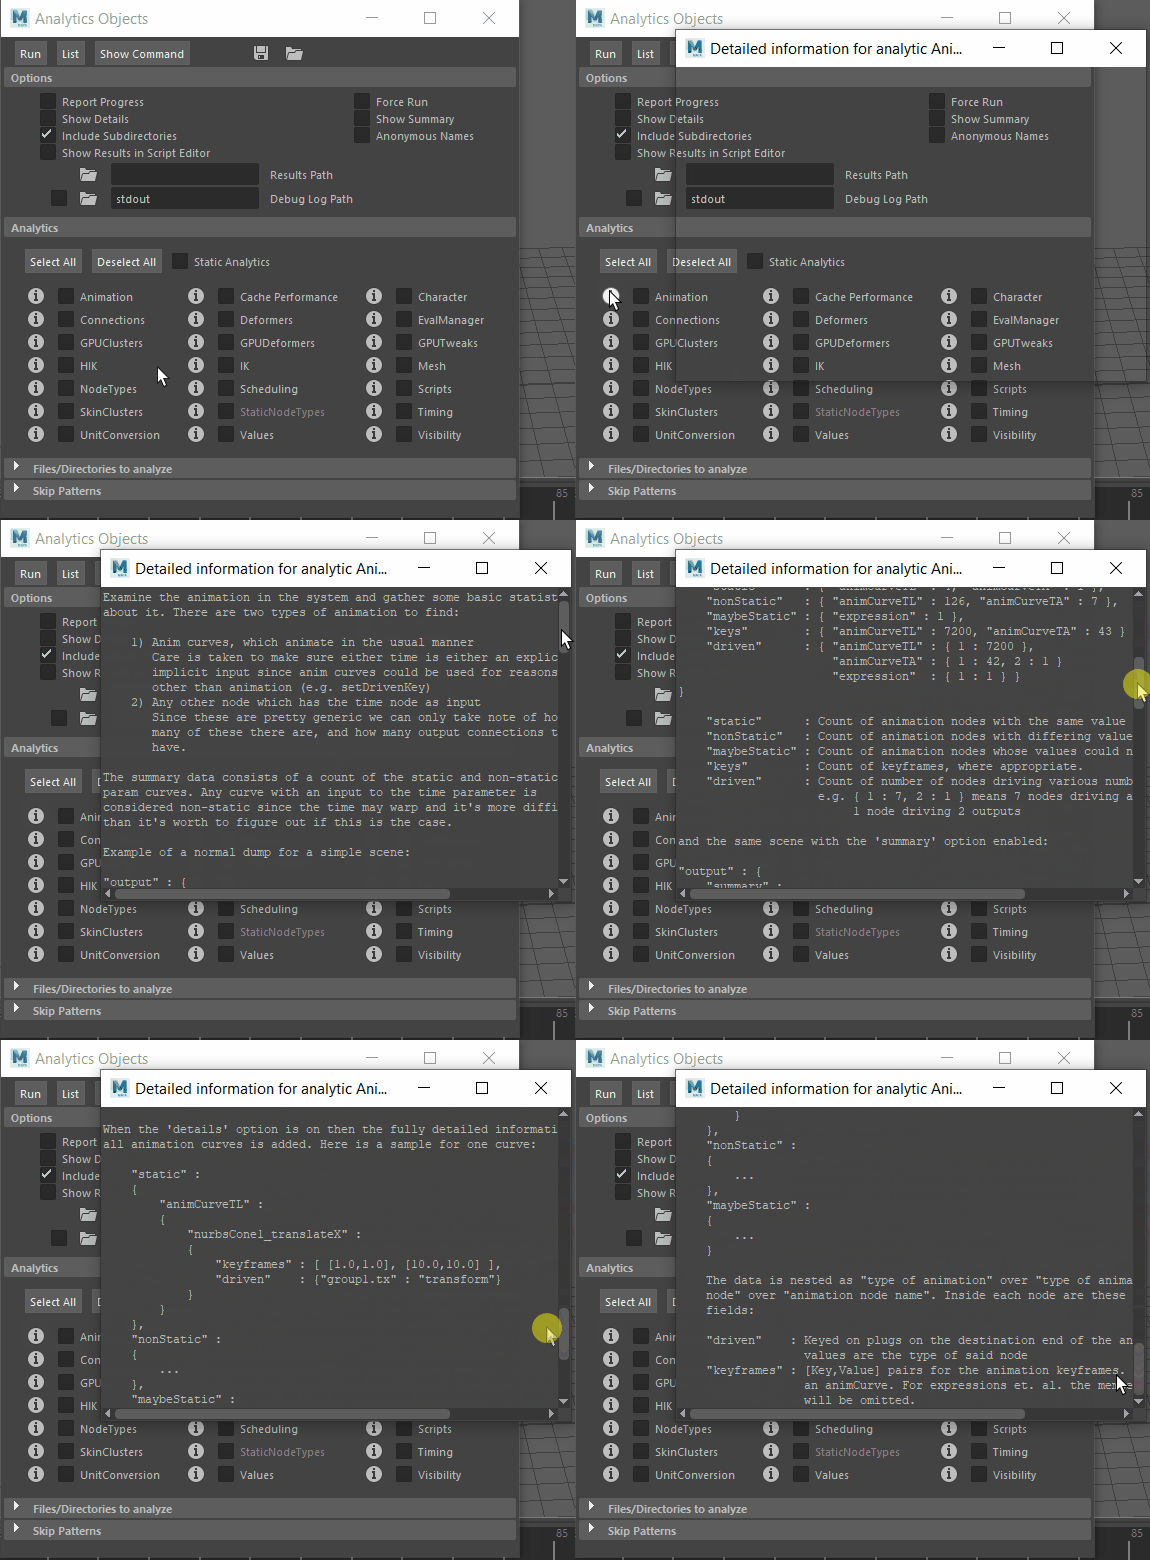
Analytics Objects
window contains detailed notes for each setting. Click the information icon
 next to a setting to view more detail.

 next to a setting to view more detail.

- Run
- Launches the selected analysis.
- List
- Displays which analytics would be run in the Help line.
- Show Command
- Displays the analytics command details.
- Save

- Saves the current configuration in a file.
- Load

- Opens configuration settings from a file.
Options
Select which elements you want to include in your analytics:
- Report Progress
- Shows a progress dialog as analytics are run.
- Force Run
- Create a new analytics report even if older reports are available.
- Show Details
- Toggles the collection of detailed analytic information.
- Show Summary
- Activate to include a summary in analytic output.
- Include Subdirectories
- Activate to include subdirectories in selected data directory.
- Anonymous Names
- Activate to anonymize files names and nodes.
- Show Results in Script Editor
- Activate to display a list of the tests run in the Script Editor.
- Results Path

- Enter a destination to save test results. Leave this field blank to store result files in the same location as the test file.
- Debug Log Path

- Activate this option to create a debug log and enter a destination in the field to save log files. (If this option is active and you do not specify a field, log results are saved in stdout, the default log directory.)
Analytics
Choose Select All, or Deselect All to either include or exclude all analytics from the test.
Activate Static Analytics to run the tests independent of files.
- Animation
- Provides basic statistics on animation in te file.
- Click the "i" button
 to read additional detail about this data.
- Cache Performance
- Provides statistics on cache performance.
- Click the "i" button
 to read additional detail about this data.
- Character
- Examines the characters in the scene to rpvide a few basic structure elements.
- Click the "i" button
 to read additional detail about this data.
- Connections
- Provides a report of all the connections in the DG.
- Click the "i" button
 to read additional detail about this data.
- Deformers
- Examines meshes in the scene and provides a report on the deformers used.
- Click the "i" button
 to read additional detail about this data.
- EvalManager
- Provides information on the Evaluation Graph and scheduling in the scene.
- Click the "i" button
 to read additional detail about this data.
- GPUClusters
- Provides information on animated cluster nodes and how they are used.
- Click the "i" button
 to read additional detail about this data.
- GPUDeformers
- Provides information on animated deformer nodes and how they are used.
- Click the "i" button
 to read additional detail about this data.
- GPUTweaks
- Prvides a list of animated Tweak nodes and how they are used.
- Click the "i" button
 to read additional detail about this data.
- HIK
- Scans all HIK connections to locate any unrecognized patterns.
- Click the "i" button
 to read additional detail about this data.
- IK
- Analyzes the structure and use of standard IK systems in the scene.
- Click the "i" button
 to read additional detail about this data.
- Mesh
- Analyzes the volume and distribution of mesh data.
- Node Types
- Collects the number of each node type in the scene.
- Click the "i" button
 to read additional detail about this data.
- Scheduling
- Verifies that the scheduling graph generated is similar to the graph generated by the dbpeek command.
- Click the "i" button
 to read additional detail about this data.
- Scripts
- Provides the number of scriptJobs in the scene.
- Click the "i" button
 to read additional detail about this data.
- SkinClusters
- Examines the skin cluster nodes in the scene for connections on the driver points attribute.
- Click the "i" button
 to read additional detail about this data.
- Static Nodes Types
- This option is currently disabled.
- Click the "i" button
 to read additional detail about this data.
- Timing
- Provides scene timing information from the Profiler, with or with invisibility evaluator active.
- Click the "i" button
 to read additional detail about this data.
- UnitConversion
- Collects statistics of connection types that use unit conversion nodes.
- Click the "i" button
 to read additional detail about this data.
- Values
- Performs an analysis of plug values that make simple algorithms complex.
- Click the "i" button
 to read additional detail about this data.
Files/Directories to analyze
In this area, you can choose where you want maya to search for data to analyze.
- Use Current Scene
- (This option is on by default.) Disable this option if you want to have Maya use a scene located in another location.
- Click New
 to set an new file path or Directory
 to set a new folder location.
Skip Patterns
Enter the patterns of file paths that should be skipped (in regular Python expression form). Click to add a new filter path.
