
Video Player is loading.
We will now look at the safety factor results, first for the whole model and then for only the welds.
Note: Conditional Procedure – If you previously ran the analysis and are returning to complete the tutorial in a separate session of
Inventor Nastran, you must perform three additional steps upon reopening the CAD model. If you are continuing immediately from the
Run the Analysis
page (within the same
Inventor Nastran session), skip ahead to Step
1 in the
Plot the Safety Factor
section of this page.
- Click
 Environments
 Begin
Autodesk Inventor Nastran to re-enter the Nastran In-CAD environment.
Begin
Autodesk Inventor Nastran to re-enter the Nastran In-CAD environment.
- Click
Autodesk Nastran Results Load Results
 . Then:
- Navigate to your tutorial working folder.
- Select the file, Hanger Weldment_QST.fno.
- Click Open.
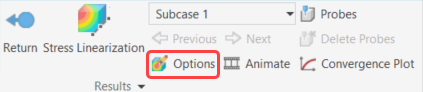
- Click
Autodesk Nastran Results Result Options to reopen the
Plot
dialog box.
Plot the Safety Factor
Refer to Figure 1 – 1.c for the following four steps.
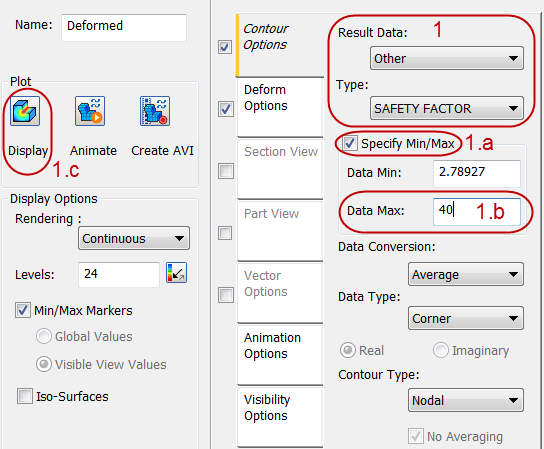
Figure 1 – 1.c
- From the
Result Data pull-down menu, choose
Other, and set
Type to
SAFETY FACTOR.
- Activate the Specify Min/Max checkbox.
- Type
40 into the
Data Max input field. This value produces a fuller, and more meaningful, color spectrum on the contour plot.
Tip: The actual maximum safety factor is many times greater than the minimum value, which skews the contour color towards red for most of the model. Reducing Data Max reduces the range of the plot legend and eliminates the skewed contour problem. Resolution is lost at the higher safety factor values, which appear as dark blue (in this case, values over 40). This is inconsequential, since the low safety factor values are the ones of interest.
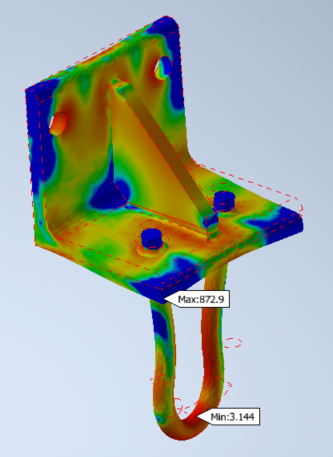
- Click
Display. Your safety factor contour plot should be similar to the following image:
Refer to Figure 1.d – 1.i for the following six steps.
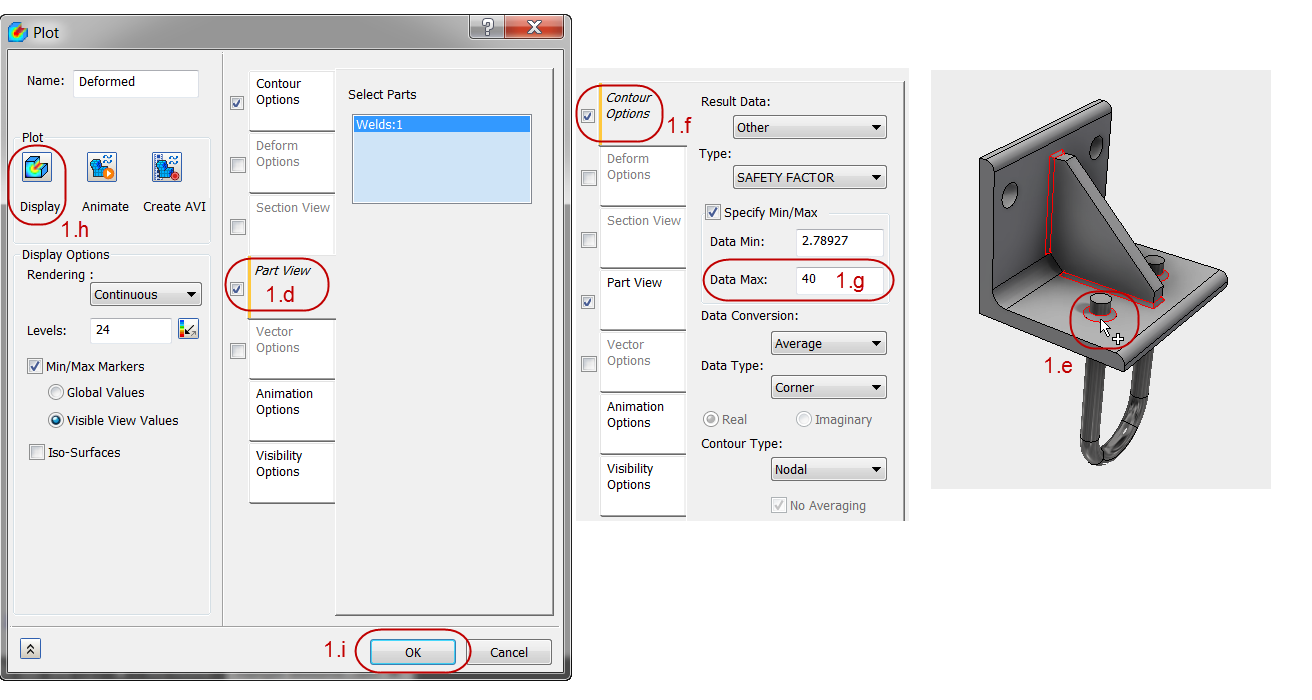
Figure 1.d – 1.i
- Click on the Part View tab of the Plot dialog box.
- In the model canvas, click on one of the weld beads to select the Welds part. The part name appears in the Selected Parts list in the Plot dialog box.
- Click on the Contour Options tab of the Plot dialog box.
- Once again, type 40 into the Data Max input field. (Reducing the number of displayed parts reset the data range.)
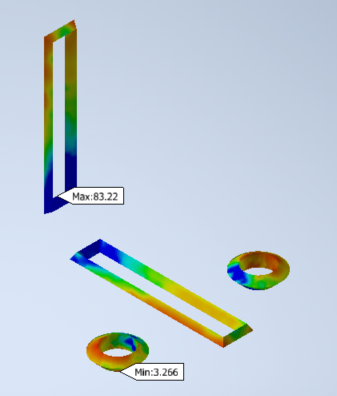
- Click
Display. Zoom in for a better view of the welds if desired. Your safety factor contour plot should be similar to the following image:
- Click OK to exit the Plot dialog box.
This concludes the Welded Steel Hanger, quick start tutorial. Where would you like to go next?
| Previous Topic: Evaluate the Stress and Displacement Results | Return to: Quick Start Tutorials (introduction) | Return to: New User Quick Start (introduction) |