
You can display results of time history analysis as diagrams, maps or structure deformations. You can draw diagrams for the envelope or for each of the time components. After selecting the additional load case (+/-) generated for envelopes, Robot displays envelopes.After selecting the main case, the results of a single component with particular time steps become available. Select Results menu > Advanced > Time History Analysis - Diagrams to display the following dialog.
Graphical results of time history analysis are presented as time-dependent diagrams of a selected quantity in a selected time history analysis case.Diagrams and tables with their descriptions display in the Time History Diagrams window.
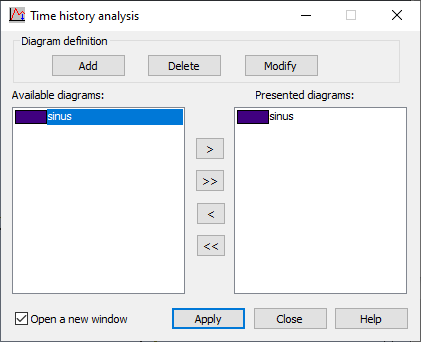
Time history analysis dialog
- Diagram definition
Add - Opens a dialog for defining a new function
Modify - Opens a dialog box for defining a function (you can change the function name or value that is currently selected on the selection list)
Delete - Deletes a definition of the function that you selected on the list
- Available diagrams (lists defined diagrams) and Presented diagrams(diagrams selected to be displayed)
> - transfers a selected diagram to the right panel
>> - transfers all diagrams to the right panel< - deletes a selected diagram from the right panel
<< - deletes all diagrams from the right panel.
The panel with defined diagrams has 2 types of functions:
- all the user-defined functions included in the selection list at the top of the dialog
- time functions defined as time history analysis data in theAnalysis Type dialog (transferred by default from THE load case definition)
- Open in new window - Select this option to open a new window with appropriate diagrams.
After defining diagrams and transferring them to the Presented diagramspanel, click Apply to display selected diagrams in a window. An example of a diagram for a time history analysis case is in the following image.
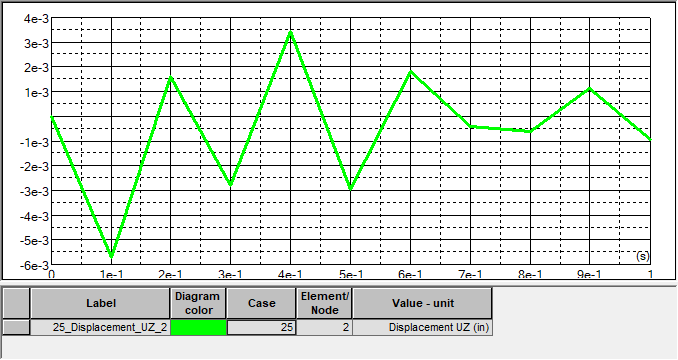
In the upper part of the image are diagrams of selected quantities, superimposed in one image. The values of abscissa are the time variable values.Diagram descriptions and values of the extremes for selected quantities are in the table.
Click the table and righ-click the mouse to open the context menu and select Columns. It opens a dialog to select quantities to be included in the table below time history analysis diagrams.
Context menu options (Diagrams - properties menu):
- Display main grid lines - Toggles main grid lines in the diagram for a time history analysiscase
- Display intermediate grid lines - Toggles intermediate grid lines for a time history analysiscase
- Automatic range - Adjusts the ranges on the coordinate axes of the diagram to the range of time variability of a selected quantity
- User-defined range - Defines a time span for which the diagram ofa time history analysiscase is displayed.