
After Generative Design in Revit has finished creating a study, use views and charts in the Explore Outcomes dialog to find the solutions that best meet your needs.
To change outcome views, click the icons at the top of the dialog, below the study's name.
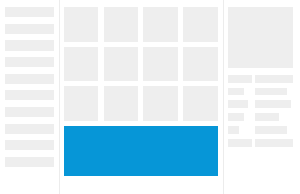
- Grid
 : View and manipulate 3D image previews.
- List
 : View numerical detail of each outcome.
Charts display at the bottom center of the Explore Outcomes dialog. If charts don’t appear, select the Charts check box in the top right corner of the dialog.
- Parallel coordinates chart
 : View all the inputs and outputs of your study simultaneously.
- Scatterplot
 : Control which inputs and outputs you want to display, and format them by size or color.
In a Generative Design study, outputs indicate resulting values for this outcome. For example, in a Maximize Window Views study, outputs may be the view to outside score and the average angle to windows.
Inputs show the values used to generate the outcome. For example, in a Maximize Window Views study, inputs may include a room, an element to calculate the view from, and obstruction elements.
Select an outcome by:
- Clicking an image preview in grid view,
- Clicking an outcome in the table in list view,
- Clicking a point in the scatterplot, or
- Filtering down to a specific outcome in the parallel coordinates chart.