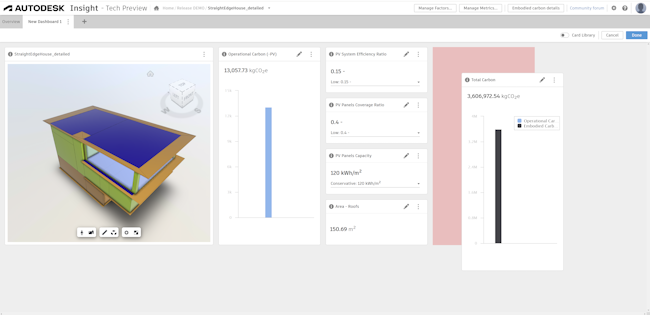
About Custom Dashboards
Personalized dashboards allow you to examine model data, understand analysis results, and observe key metrics pertinent to your design.

Upon submitting an energy analysis to Insight, you are presented with an Overview Dashboard and Embodied Carbon Details. These offer valuable insights into the performance of your design and its environmental implications. From this point, you have the option to create custom dashboards (up to a maximum of 10 dashboards), for an even more in-depth analysis of your model's data.
Your custom dashboards are composed of "cards" added to the dashboard. The following card types are available:
- Data Display - Report a value from data in your model. A Data Display can be configured to report analysis results, metrics, or model data.
- Analysis results - Data points generated by simulation and analysis engines such as EnergyPlus.
- Metrics - Key performance indicators used to target, track, and trade-off different design performance decisions. You can create custom Metrics for your analysis. For additional information on creating a custom metric see Custom Metrics.
- Model Data - Data contained in the model uploaded to Insight.
- Dropdown - Link a Dropdown card with a factor having multiple values, for instance, a factor such as 'Reference study period'. Changing the value of the Dropdown on the dashboard will update other cards linked to data using the same factor. You can create custom Factors for your analysis. For additional information on creating a custom factor see Custom Factors.
- Bar Chart - Display a Metric value in a bar chart. If the metric is comprised of data from various sources, the bar chart will be divided into different colors representing the distinct values.
- 3D View - A 3D representation of your analytical model.
- Text - Incorporate freeform text to a card on the dashboard.
For additional information on creating a custom dashboard, see Create a Custom Dashboard.
