
Post-tensioned Concrete Beam Analysis
Description
The type of analysis that will be carried out is determined by the item selected from the drop-down list labelled 'Analyse for'. If the analysis selected is Geometry Check & Section Properties, or 'Differential Temperature', or 'Shrinkage/Creep' then the analysis will be of the section at the current point of interest indicated by a vertical line in the graphics window.
The point of interest may be changed in the field labelled 'Result Point of Interest' or by placing the cursor over the red vertical line in the graphics window to highlight it and then holding the mouse button down while dragging it to a new point (drag and drop).
A comprehensive series of data checks are carried out before the analysis takes place.
Cursor Control
- Clicking on the beam elevation in the graphics window accesses the Define Post_tensioned Tendons form for editing the tendon data as necessary. (The click position along the beam will be the position at which the section is displayed on the Define Post_tensioned Tendons form).
- The value of each of the results at the current point of interest is shown to the right of the graph. The point of interest (and thus the results shown) may be changed in the graphics window using 'drag and drop'.
- The value of a single result may be seen in the 'status bar' of the graphics window by placing the cursor over any point of any result line.
Results
The calculations are performed at a number of 'Points of Interest' determined by the program. If results at a specific location are required, click on the Points of Interest button, and add the location to the Points of Interest form.
The results are displayed graphically. Generally the blue lines are permissible load effects, and the green lines are actual load effects (unless these are anywhere greater than the permissible, in which case they are plotted in red). The data series colours can be changed using the Preferences form.
The graphics legend indicates what each line represents. The legend may be moved using 'drag and drop' and may be re-sized using the Graphic Chart Toolbar.
Full details of the calculations are given in the printout for the designated section, or may be viewed on the screen by pressing the F5 key or by clicking on the Results button.
Basic quantities for the beam are also displayed on this form. For multi-span beams, these quantities are for all spans.
Form Graphic
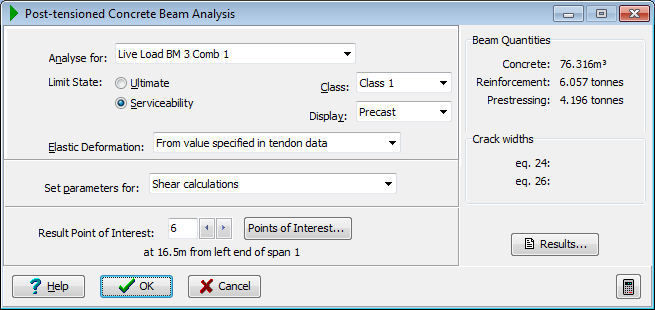
Field Help
Analyse for
Select the load case for which the display of results is required.
If the analysis selected is for a live loading, it is the live load and load combination together that is selected.
If the analysis selected is Geometry Check & Section Properties, or Differential Temperature, or Shrinkage/Creep then the analysis will be at the section designated as the 'Result Point of Interest' and indicated by a red vertical line in the graphics window.
Limit State
Results may be displayed for either the Ultimate Limit State, or the Serviceability Limit State. For SLS the graphics window display will show limiting stresses and actual stresses along the beam, and for ULS the graphics window display will show the ultimate moment capacity, together with the applied moments. Note that shear force calculations are produced for ULS only. (see clause 5.1.2.1 of BS 5400 Part 4).
Class
The flexural tensile limitations depend on the classification of the structural element as class 1, 2 or 3 as described in clause 4.1.1.1(b) of BS 5400 Part 4. Generally class 1 will be appropriate to load combination 1, and class 2 for load combination 3. This is described in clause 4.2.2 of BS 5400 Part 4, with modification by the DoT DMRB BD 24/92. Reference may be made also to clause 6.3.2.4 of BS 5400 Part 4.
Display
For the Serviceability Limit State results, the graphics window will show the stresses for the concrete that is defined for the section stage selected in this field.
Elastic Deformation
Elastic deformation losses arise in the tendons principally resulting from tendon stressing in concrete that is already prestressed by other tendons. It is never feasible to stress all tendons at the same time. There are three ways of allowing for these losses in the calculations. These are described below.
| Loss type | Description |
|---|---|
| Calculated from Construction Sequence data | When the construction sequence is fully defined, and the structure is determinate, the elastic deformation losses can be calculated by the program using the tendon data, and the section geometry information. |
| Included with load data for secondary effects | If this option is selected the elastic deformation losses are not calculated from the construction sequence data, but are assumed to be included with he secondary effects in the load case data for construction sequence loadings and / or live loadings (i.e. the loadings that are displayed on the Define Beam Loads form when the Show Secondary (parasitic) Effects radio button is pressed. |
| From value specified in tendon data | The tendon loss data includes the option to specify a percentage figure for the elastic deformation losses. This approach corresponds to the first alternative described in the third paragraph of clause 6.7.2.3 of BS 5400 Part 4 : 1990. If a value is included in the tendon data it will be used whatever the option set from this field. A warning is therefore issued if this selection is not selected here, and a value for elastic deformation loss has been specified in the tendon data. |
Set parameters for
Various parameters used in the analysis are stored by the software and may require changing from the default values. The parameters for the shear calculations, and for differential temperature calculations may be modified by making the appropriate selection from this field. If the data has been defined as precast beams with in situ, the option to specify or differential Shrinkage/Creep parameters for these calculations is also available.
Result Point of Interest
This field is used to locate the section for which detailed calculations will produced in the output. Default points of interest are:
- sections at which a different beam cross section has been defined in the data.
- sections at segment interfaces
- sections at which loadings have been defined.
- sections where reinforcing bars start and end.
- for shear force calculations only, additional design sections are located close to supports.
Use the Left / Right arrows to move the Result Point of Interest forwards or backwards along the beam. Alternatively the point of interest reference number may be entered directly.
Points of Interest
Click on this button if results are required at a specific location that is not currently included as a default point of interest.