
Interaction Curve Analysis
Description
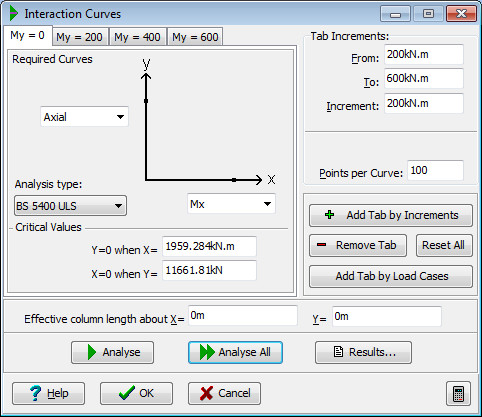
For the three action effects of axial load (Ax), bending about the x axis (Mx), and bending about the y axis (My), a plot may be produced of the section at capacity for any two of the three effects for a given value of the third. There are therefore 3 possible combinations of axes (Ax / Mx; Ax / My; Mx / My), and the x and y axes may be interchanged making a total of 6 possible configurations for the plot.
The procedure is first to set the axes to the required two action effects, then if the third effect is to be non-zero, or a range of values are required for the third effect, to set appropriate 'Tab' values using the 'Tab Increments' panel, and clicking on the Add Tab by Increments button or the Add Tab By Loadcases button (which only creates additional tabs if the third effect varies). The number of points on each curve may be varied from the default value up to a maximum of 100 points depending upon the resolution required.
Calculation is initiated when the F6 key is pressed or by clicking on the Analyse button. A comprehensive series of data checks are carried out before the analysis takes place, and appropriate warning messages issued. The interaction curves can be viewed in tabular form by pressing the F5 key or clicking on the Results button.
One graph is generated for each tab and the graph corresponding to the current tab is displayed. These can be viewed by changing the current tab and, if not previously analysed, calculating the new graph. The graphs for all the tabs may be calculated at the same time by clicking on the Analyse All button.
The fields labelled 'Critical values' show the values at the intersection with the x axis and y axis.
If values are entered in the 'Effective column length' fields, eccentricity moments and slenderness moments will be allowed for in the curves. The program will determine if the column is short or slender and calculate the appropriate additional moments. The curves may therefore be used taking the factored design moments for both the Mx and My bending effects.
The 'Analysis type' dropdown list allows different analysis methods to be used.
For some column geometry and combinations of axial load and bending the iterative algorithms that are required for the solutions may not converge. In this case an interpolation is made between adjacent points on the curve which have successfully converged, and a message is issued after the analysis is complete stating how many points have been interpolated in this way.
Form Graphic
Field Help
Analysis type
The analysis types that may be selected are those which involve strain compatibility analysis of concrete sections.
Additional information about the analysis types is given in the topic Bending, Axial and Shear Analysis.
Required Curves (X and Y axis)
Select the action effect for the adjacent axis from this list.
Tab Increments
When the action effect for each of the two graph axes has been set, then if the third effect is to be non-zero, or a range of values are required for the third effect, these values may be set by using these fields to generate a tab page for each value required.
'From', 'To' and 'Increment' are the values used to generate new tabs.
- From - the number of the first new tab that will be generated.
- To - the number up to which new tabs will be generated.
- Increment - the difference between new tabs' values.
The tab pages are generated by clicking on the Add Tab by Increments button. The current tab page is be removed by clicking on the Remove Tab button. All tab pages are removed by clicking on the Reset All button.
Points per Curve
Input the number of points that will make up a graph. The higher this value the smoother and more accurate the curve will be. The minimum number of points is 6 and the maximum is 100.
Effective column length about X/Y
A non-zero value input here will indicate to the program that the section is a column. The value entered will be used to determine whether the column is short or slender in accordance with the definition is clause 5.5.1.1 of BS 5400 Part 4 1990. If it is found to be slender the slenderness moments be calculated in accordance with clause 5.5.5.4.
Construction tolerance moments (clause 5.5.4) are included for both short and slender columns.
If a value of zero is entered, the program will assume the section is a beam and will not include construction tolerance moments.
A value of zero should also be entered for Serviceability Limit State analysis.