
Parallel Analysis
Use this form to run a linear structural analysis using multiple CPU threads. The numerical results are identical to a standard single-thread run; only the execution strategy differs.
Refer also to Analyze Structure for general behavior that applies to both modes.
Parallel analysis can significantly decrease the time to analyze larger or more complex models, particularly when any of the following apply:
- finite elements are present;
- a large number of load cases are solved (50+);
- post-tensioned tendons are included.
For models without the above characteristics (e.g. a modest grillage with few loads), the scheduling overheads and post-processing may outweigh the benefit and a single-thread run can be faster.
For a single-thread run choose Calculate | Analyze Structure. For a multi-threaded run choose Calculate | Parallel Analysis.
This form can also be accessed from the Influence Surface Generation form when the 'Direct All Parallel' generate method is selected.
Outline Procedure
- Review the Threading and Analysis Memory settings on this form.
- Click Analyze to start the run.
- When complete, click Results... to open the most recent results (this button is not available when launched from Influence Surface Generation).
Once analyzed, and the form is closed, the results can also be opened via Report | Structural Results, or the results icon on the main form status bar.
If a memory overflow message occurs, adjust the memory settings here and re-run. Lower memory settings per thread may be required compared to a single-thread analysis. See the Memory Settings form for guidance.
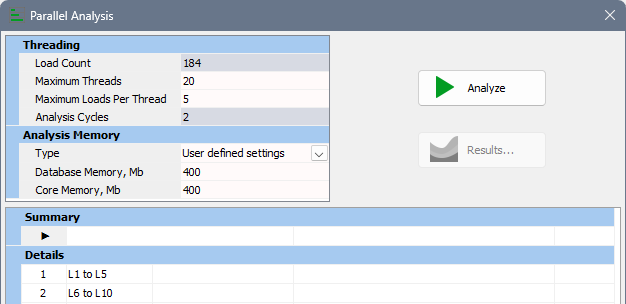
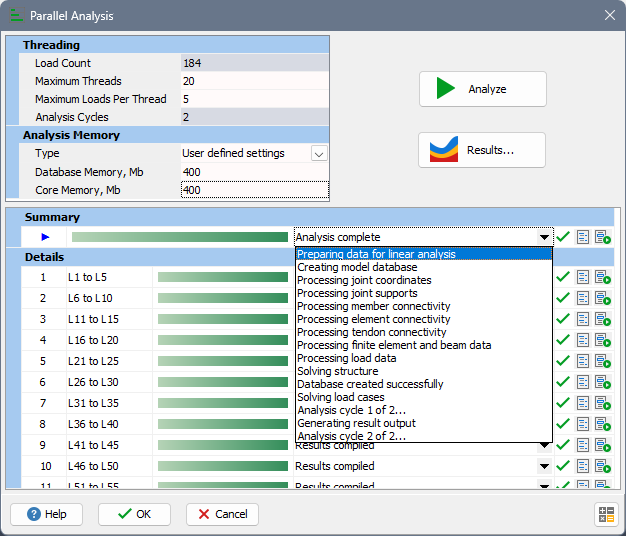
Form Graphic (before analysis)
Form Graphic (after analysis)
Field Help
Threading
Load Count
The number of individual solves to be performed for the current model.
For structural analysis, this equals the sum of all structural load cases and structural tendon effects (if present). All structural loads are included; Loading Sets are ignored for parallel analysis.
For influence surface analysis, this equals the number of joints in the model deck.
Maximum Threads
Upper bound on the number of worker threads used by the solver. The effective value is limited by the machine's hardware thread limit. The default is 80% of the available hardware threads. Larger values generally reduce total analysis time, but setting 100% can reduce overall machine responsiveness while the analysis runs. Reducing this value typically increases the number of analysis cycles and may increase total analysis time. This value is stored in the Windows registry and applies application-wide (not model-specific).
Maximum Loads Per Thread
Caps how many loads a thread will tackle in one cycle. Reduce this if memory is constrained; increase to reduce scheduling overhead on small models. Lower values typically increase the number of analysis cycles and may increase total analysis time. This value is saved with the model and is model-specific.
Analysis Cycles
The number of passes required to process all loads given the above limits. Cycles are performed in series; more cycles usually increase total analysis time. Approximately equal to:
Load Count / (Maximum Threads * Maximum Loads Per Thread)
rounded up to the nearest whole number.
Analysis Memory
Type
One of: 'Default settings', 'Small model', 'Medium model', 'Large model', or 'User defined settings'. The size presets apply recommended memory allocations; 'User defined settings' enables the fields below so you can enter custom values. See Memory Management for guidance.
Database Memory
Virtual memory reserved for model data. Enabled only when 'User defined settings' is selected. Increase if a DATABASE OVERFLOW occurs.
Core Memory
Virtual memory reserved for the matrix solution. Enabled only when 'User defined settings' is selected. Increase if a CORE OVERFLOW occurs.
Summary and Details
The Summary bar shows overall progress while the analysis is running. The Details list displays the loads that will be assigned to threads for each cycle. Rows show contiguous ranges by type (for example, L1 to L5 means Load cases 1 through 5; T1 to T5 means Tendons 1 through 5). This list updates automatically when threading limits change.
Grid Controls (during and post-analysis)
Progress bar and status
Shows the execution status for the overall run and for each group. The status text can be expanded to show the list of analysis steps.
Progress indicator
A green check mark indicates the analysis and results compilation for the row completed successfully. Other icons indicate job in progress or failure.
Open log
There are two log buttons: the left button displays the log for the overall run or for the selected group; the right button shows the output from the analysis engine.
Commands
Analyze
Starts the parallel analysis using the current settings.
Results
Opens the results from the last successful run. This button is not available when the form is launched from Influence Surface Generation.
Stop
Stops the analysis during the run.
Notes
Results are numerically identical to a single-thread run for the same model and options.
A key advantage of parallel analysis for large models is memory handling: single-thread analysis can hit the operating system's maximum contiguous virtual memory limit. In parallel analysis each worker allocates its own virtual memory, so the effective limit is per thread rather than overall, which can allow larger models to be analyzed successfully.