
Air velocity result
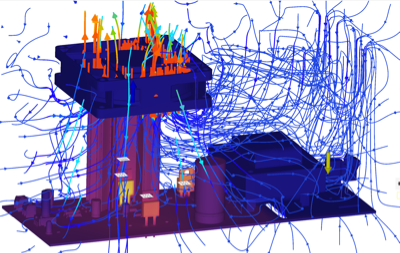
The Air Velocity result shows the movement of the air surrounding the components in the model enclosure.
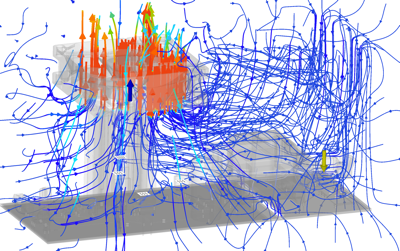
Figure 1 Flow lines visualization showing the velocity and direction of the air flow.
Things to look for
When viewing the Air Velocity result, watch for the following:
- The direction of air flow, to ensure hot air is not being blown over sensitive components
- Areas of low air velocity, showing where air might be stagnating
- Large differentials in air velocity which may suggest air is not reaching all areas sufficiently.
Using this result
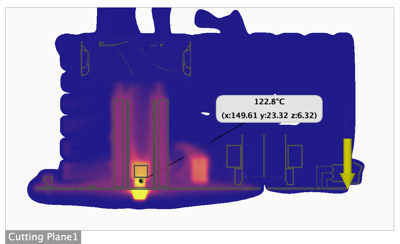
Move the Range of interest sliders on the left of the legend bar, and the Threshold sliders on the right to narrow your focus, and make the color contrast more visible.
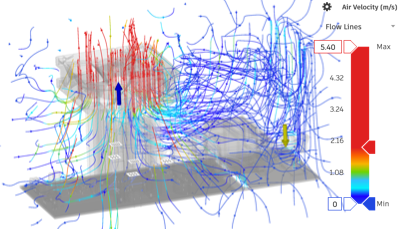
Figure 2 showing more color granularity in the air velocity around the fan.
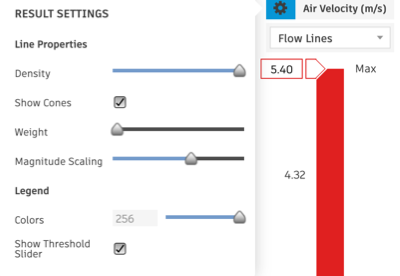
Change the appearance of the flow lines, with the Result Settings options above the legend bar.
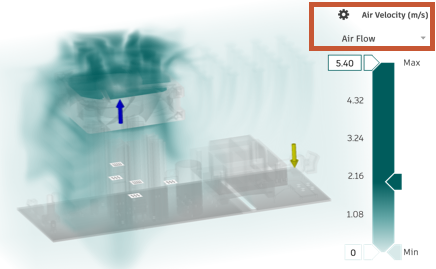
Use the result visualization switcher, above the legend bar, and switch to the Air Flow visualization to get an impression of the movement of the air volume.
In the Browser, switch to the the Air velocity + Component Temperature combined result to how they might affect each other.
Use Surface probes, Point probes, and Cutting planes to inspect the result carefully.
Next Steps
To address the potential issues highlighted by the Air Velocity result, you could:
- Switch board components for different ones that can tolerate higher temperatures
- Select a component that meets the performance requirements but requires a lower internal heat load
- Change the dimensions or material used in the heat sink
- Add a fan, if there isn't one
- Change the location of the fan to move the fluid flow path away from heat sensitive components
- Reverse the blowing direction of the fan.