Use this page of the wizard to review the analysis results and to apply them to the pipe network.
- Export the Results to CSV and View in Profile
- Saves the results to a .csv file in a specified location and displays temporary graphics in an existing profile view so you can preview the results. You are prompted to select the profile view to use if more than one profile view exists in the drawing.
Note: If the pipe network has not been added to a profile view, or if a profile view does not exist in the drawing, the results cannot be viewed graphically.
For more information about the data included in the .csv file, see About the Gravity Network Analysis Results Report.
After specifying the exported file name and location and saving the file, you can transparently zoom and pan (enter 'z or 'p at the command line) to an existing profile view to see a preview of the EGL, HGL, and pipe changes. The colors shown in profile view are specified in the Analyze Pipe Network Settings dialog box, which you can access from the General page of the wizard.
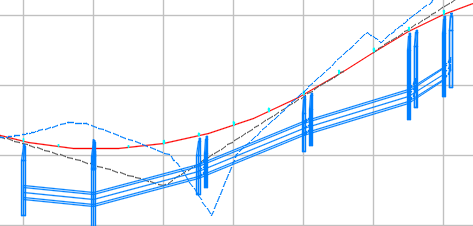
The following illustration shows the existing pipe network in profile view.

The following illustration shows how the preview graphics might appear. In this case the analysis determined that smaller pipe sizes could be used for the selected AEP.

In the preview, structure depths are not adjusted because they are connected to the original pipes rather than the resized ones. However, when the results are applied to the pipe network, the structure depths are adjusted to accommodate the adjusted pipes, as shown in the following illustration.

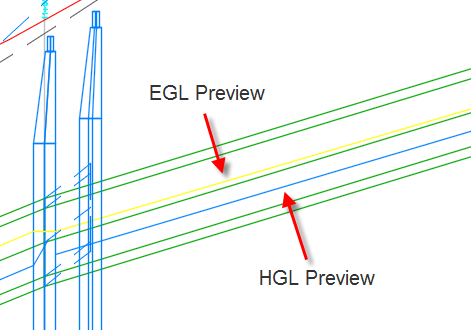
The following illustration shows a detail of the EGL and HGL lines in the preview.

A preview of the resized pipes is also shown in plan view.
 Note: When you are finished examining the preview graphics, press ESC or Enter to return to the wizard.
 - Modify the Results
- Applies the calculated results into the Pipes page of the wizard so you can modify the data and re-run the analysis.
Note: This option is selectable only if Resize Pipes and Reset Inverts was selected on the General page.
Changed values are displayed in bold and blue text. The changes are shown in bold gray text if the field is read-only, and they are shown in bold blue text if the field is writable. In this example, pipe lengths, diameters, invert elevations, and slopes were all changed.

- Apply the Results to the Pipe Network
- Applies the calculated results to the pipe network.
- If you selected
Resize Pipes and Reset Inverts, applying the results update the pipe sizes and invert elevations according to the calculated results, and will apply all of the calculated properties to the pipe network.
Note: Applying the results to the pipe network does not apply energy and hydraulic grade values unless the Compute Energy and Hydraulic Grade Lines option was also selected on the General page.
- If you selected Compute Energy and Hydraulic Grade Lines, applying the results will apply the calculated energy and hydraulic grade values to the affected parts in the pipe network.
- If you selected
Resize Pipes and Reset Inverts, applying the results update the pipe sizes and invert elevations according to the calculated results, and will apply all of the calculated properties to the pipe network.