How to generate schematic and panel reports, change the report format, save a report to a file, and place a report on a drawing.
Generate Schematic or Panel Report
- Do one of the following:
- Click
 . Find
- Click
. Find
- Click
- Select which report to generate from the report list.
- Select to process the project, current drawing, or selected components.
- Specify any report options (if applicable).
- Select installation or location codes to extract (if applicable).
- All. Extracts all components regardless of value.
- Blank. Extracts only those components that do not have a value.
- Named. Extracts only those components that have a value matching the value entered in the box. Wild-card characters are supported.
- Indicate whether to update the project database or the wire connection table with out-of-date drawings.
- Click OK.
- Sort the report, change the format, or edit the data.
- Save the report to a file, place the report on the drawing as a table, or print the report.
Generate an Electromechanical Bill of Material Report
Create a Bill of Material report that contains components from your electrical project and linked Inventor assembly.
- Do one of the following:
- Click
. Find
- Click
. Find
- Click
- Select Bill of Material from the report list.
- Select to process the project.
- Check Include Inventor Parts.
Note: If your project is linked to an Inventor assembly, this check box is enabled.
- Specify any report options.
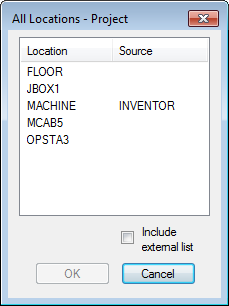
- Select installation or location codes to extract.
- All. Extracts all components regardless of value.
- Blank. Extracts only those components that do not have a value.
-
Named. Extracts only those components that have a value matching the value entered in the box. Wild-card characters are supported.
The Drawing button is disabled but you can select a value from the Project list. The project lists for Installation and Location include values from the Inventor assembly. Values from Inventor are indicated in the Source column.
- Click OK.
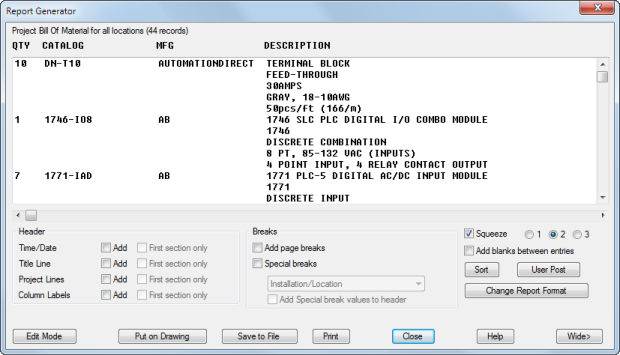
Change the Report Format
Define which fields to include in the report, the field order, the field labels, and field justification.
- Generate a report.
- In the Report Generator dialog box, select Change Report Format.
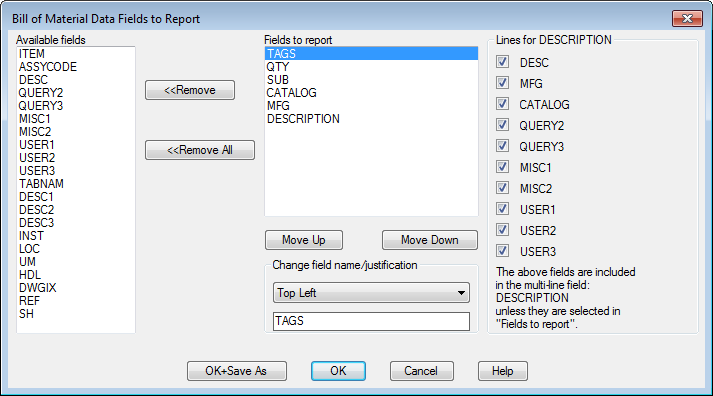
- Click a field in the Available Fields list to add it to the Fields to Report list.
- Select a field in the Fields to Report list.
- Use the Move Up and Move Down buttons to change the field order.
- Edit the field name.
- Select a justification for the field.
- (Bill of Material report only) Select fields to include in the multi-line description field.
Note: If a field is listed in the Fields to Report list, it is not included in the multi-line description even if checked Lines for Description list.
- Click OK to save the changed format to the default file name or Click OK+Save As to save to a different file name.
- Click Close.
Save the Report to a File
- Generate a report.
- In the Report Generator dialog box, select Save to File.
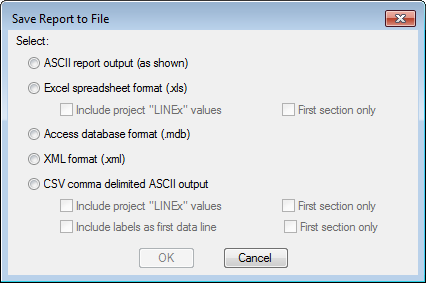
- Select the file format.
- Choose any options within the selected file type.
- LINEx values. Project description lines marked as in reports.
- Labels. Labels for the fields included in the report.
- First section only. If the report contains special breaks, select whether to include on the first section only.
- Click OK.
- Enter a file name and define the path and click Save.
- The Optional Script File dialog box displays where you can run an optional script on your report data.
- Click Close on the Report Generator dialog box.
Insert a Report as a Table
- Generate a report.
- In the Report Generator dialog box, select Put on Drawing.
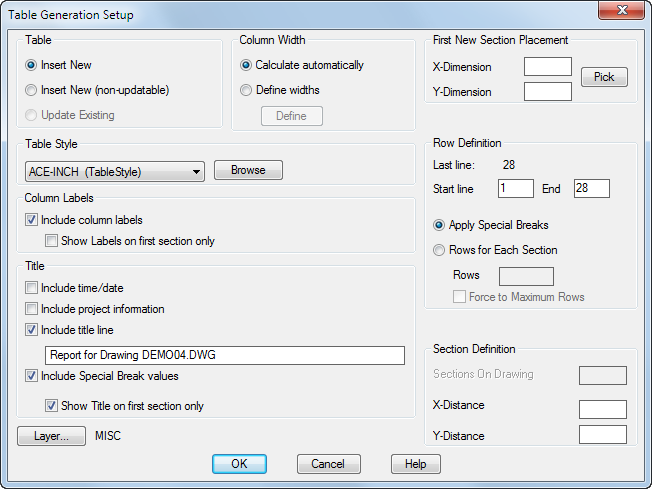
- Select the table type:
- Insert New. If the same report is run again later, the table can be updated.
- Insert New (non-updatable). If the same report is run again later, the table is not updated.
- Update Existing. If there is an existing table that matches the report, it updates. This option is not available if there are no matching tables for the report.
- Select a table style from the list. You can browse to another drawing and add any tables style on that drawing to the selection list.
- Specify whether to include any title information.
- Specify the method to use for calculating the width of the columns.
- Specify the XY coordinates for the upper left corner of the table. If left blank, you are prompted to select a location after you click OK.
- Enter a start and end line value. The default is to include all rows of report data.
- Specify the options for the rows:
- Apply Special Breaks. If you selected any special breaks on the Report Generator box, you can break the table into separate table objects based on those values.
- Rows for Each Section. Specifies to break the report into separate table objects based on the value in the Rows box.
- If table sections are defined:
- Specify the maximum number of table sections placed on each drawing. A blank value indicates an unlimited number of sections on one drawing.
- Specify the X and Y distance from the end of one table section to the beginning of the next. These values are used when there are multiple sections on the same drawing.
- Click OK.
If you did not specify the XY coordinates, your cursor is a box approximating the size of the table when it is generated. To use object snap mode, enter an S at the command line.
Edit a Report
Modify the report before you insert it to your drawing or save it to a file. You can move data up or down in the report, add lines from a catalog, and delete lines.
- Generate a report.
- In the Report Generator dialog box, select Edit Mode.
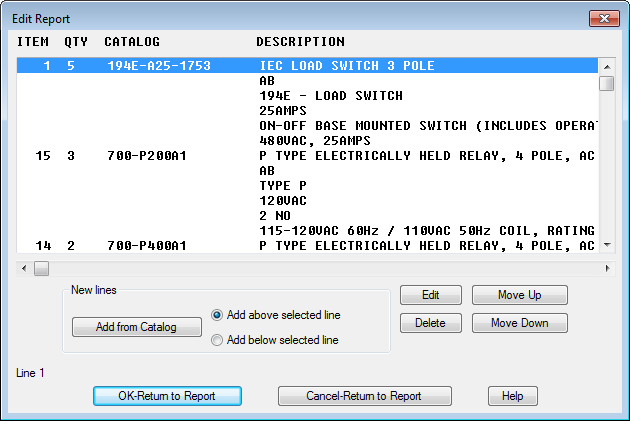
- Select a row within the report.
- Click Edit to change individual values in that row.
- Select a row or group of rows within the report.
- Click Delete to remove the selected rows.
- Use the available move options to change the order of the selected rows.
- Use the available options to add extra rows with data to the report. Options differ depending on the report type.
- If the report contains wiring information, each line item in the report can include two connected components, referred to as the From and To components. The From field labels end in a 1 and the To field labels end in a 2.
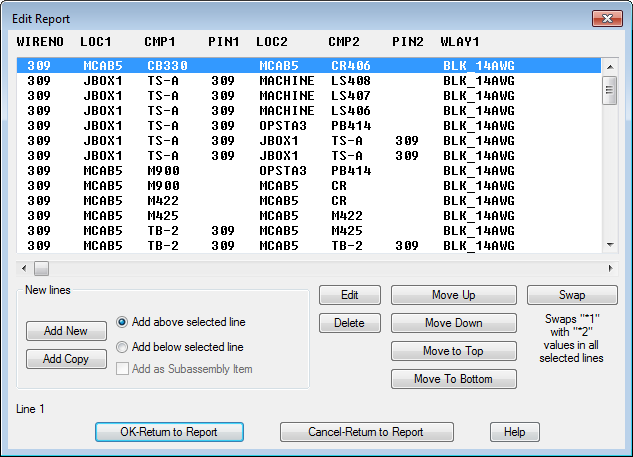
Click Swap to swap the From and To field values.
- Click OK-Return to Report.
Post-Process a Report
Further customize the report data with a custom lisp function.
- Generate a report.
- In the Report Generator dialog box, select User Post.
- Select from the available post-processing options.
- Click Close.
The LISP routine processes the data and returns to the Report Generator Window.
Sample .lsp and .dcl files for each report are installed in the C:\Program Files\Autodesk\AutoCAD {version}\Acade\Support\{language code}\Shared\ folder. A few of the reports have sample options already defined. Otherwise, these options are user created.