A report extracts the intelligence from the project drawings, formats it, and displays it on the screen.
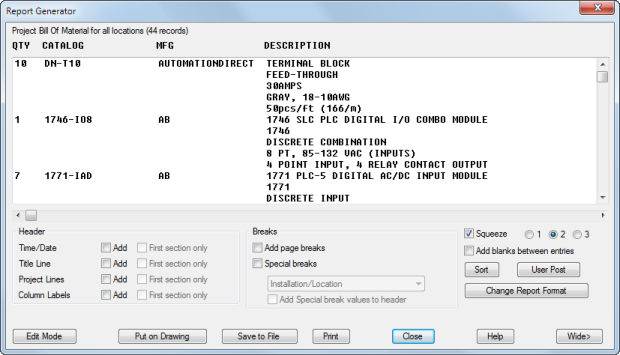
Once a report displays, you can do the following:
- Edit the report data
- Change the display format
- Post-process with your own program
- Save to a file
- Insert as a report table
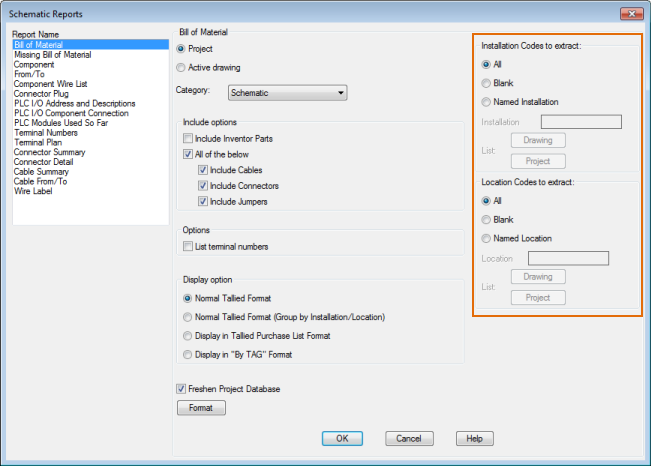
A standard set of schematic and panel reports are provided. Schematic reports extract intelligence from schematic components only. Panel reports extract intelligence from the panel components, except for the panel bill of materials which can include any schematic components not referenced on a panel layout.
Filter by Installation and Location Values
You can use installation and location filters to control the information extracted. For example, if you assign a Location code of CUSTOMER to all of the customer-supplied components, you can then filter any report using the Location code. Use the Named Location and Named Installation sections of the report dialog box to filter the report by specific values.
Use a comma to separate multiple filter values. For example, you would enter CUSTOMER,FIELD to generate a report for components with either a Location value of CUSTOMER or FIELD.
You can also use the filters to exclude components based on the Installation or Location value. For example, to generate a report of all components except components with a Location value of CUSTOMER, enter ~CUSTOMER as the Named Location. The tilde (~) prefix causes the report to exclude those components with a Location code of CUSTOMER.
Use any of the following characters in the Installation and Location filters:
| Character | Definition |
|---|---|
|
# (pound) |
Matches any single numeric digit. |
|
@ (at) |
Matches any single alphabetic character. |
|
. (period) |
Matches any single non-alphanumeric character. |
|
* (asterisk) |
Matches any character sequence, including an empty one and it can be used anywhere in the search pattern: beginning, middle, or end. |
|
? (question mark) |
Matches any single character. |
|
~ (tilde) |
If it is the first character in the pattern, it matches anything except the pattern. |
|
, (comma) |
Separates two patterns. |
|
‘ (reverse quote) |
Escapes special characters (reads the next character literally). |
Report Format
Each report extracts certain fields of information and displays them in a certain order. You can change which fields are displayed and the field order.
The format for each report can be saved in a format file (.set). The format file can include:
- Extraction options such as location or installation filters
- Fields to display
- Field order
- Field labels
- File output options
- Table output options
Format files are created automatically when you change the report format. You can also use Report Format Setup to create and edit format files. Find
User Attributes
If a report does not contain a field that you need, use the User Defined Attribute List to add fields to reports. The attribute names can be custom attributes added to your library symbols, or standard AutoCAD Electrical toolset attributes. Each attribute name added to the list becomes an available field that can be added in any report. Find
Excel Report Output
You can modify wd_template.xls to control the Excel output. For example, you can change the orientation to Landscape mode rather than Portrait mode by modifying wd_template.xls and saving it.
Post-Process
Each report type has an associated lisp file (.lsp) and dialog box definition file (.dcl) that can be customized to post-process the report data. When you run a report, the data is displayed in the Report Generator dialog box. If you click User Post, the dialog box defined in the associated .dcl file displays. The actual processing for each option on the dialog box is defined in the associated .lsp file.
Sample files are installed in the C:\Program Files\Autodesk\AutoCAD {version}\Acade\Support\{language code}\Shared\ folder. Add your own post-processing options to these sample files. Here are some examples that are in the BOM.LSP sample file.
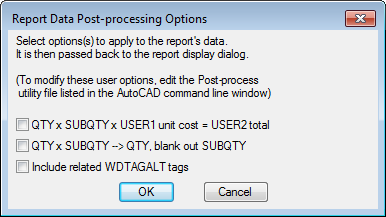
The data is passed back to the Report Generator dialog box where you can save the report as a file, insert it as a table, or print it.
Insert Report Tables
Once you generate a report, click Put on Drawing in the Report Generator dialog box to insert it as a table. Use the options on the Table Generation Setup dialog box to:
- Select a table style to control the format of the table
- Define column width
- Define the insertion point for the table
- Break the report into multiple tables that can be placed on one drawing or on multiple drawings
- Include column labels, project description lines, title, date, and time.
- Layer for the table
You also select from the following options:
- Insert New. Inserts a new table adding some intelligence on the table so that it can be updated if you run the report again. This option is not available if there is an existing table for this report.
- Insert New (non-updatable). Inserts a new table but does not add the intelligence to update the table when you run the report again.
-
Update Existing. Updates the existing table, or table sections, if the table matches the report you are running. There are three items that determine if an existing table matches the current report:
- The report that generated the table (for example, Bill of Materials, Wire From/To, Component, and so on.)
- The scope of the report (for example, project, active drawing, or pick.)
- The format file (.set) used to generate the report
Break Report into Multiple Tables
You may want to break a report into multiple tables. These multiple table objects are considered one report table and are updated the next time you run the same report. Sections are added or removed as needed.
There are two ways to break a report into multiple tables:
- Specify the number of rows per section in the Table Generation Setup dialog box.
If an entry in the report contains multiple lines of text, such as a Bill of Materials description, each line of text is considered a row. A table is not broken in the middle of a multi-row entry. The entire entry is moved to the next section.
- Select Special Breaks in the Report Generator dialog box before selecting Put on Drawing.
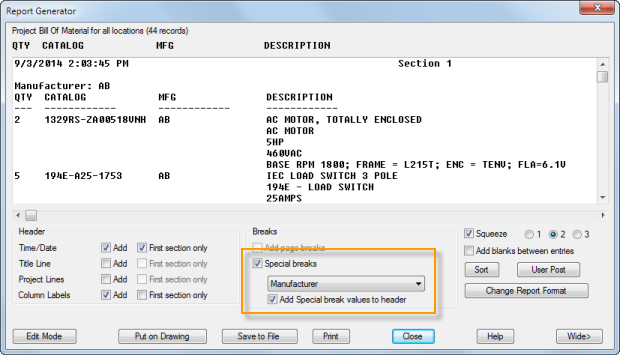
After you select Special Breaks, and click Put on Drawing, the Apply Special Breaks option is available in the Table Generation Setup dialog box. This option inserts a table object for each section based on the Special Breaks.
Note: Different reports may have different Special Breaks available.
If the scope of the report is set to Project, you can break a report table across multiple drawings. Once you have defined a break as described, you can define how many table sections you want on each drawing.
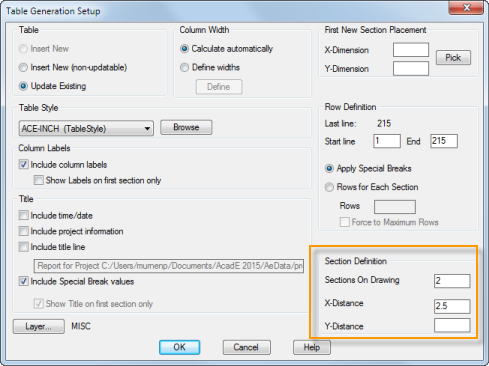
If the Sections On Drawing is blank, all tables for the report are inserted on the same drawing. If you enter a number for the Sections On Drawing value, you are prompted for another drawing each time that number of table sections is reached. You can insert the tables in existing drawings or new drawings. New drawings are added to the active project.
Run a Group of Reports
You can run one report at a time, or use Automatic Reports to run a group of reports. When you run a group of reports you can save each report to a file, place each report as a table, or both. Find
Select the report name and a format file (.set) for each report you want to run. The format files should define either file output, table output, or both.
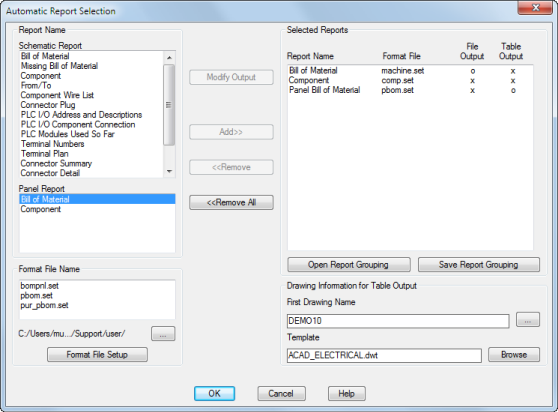
You can save the report grouping so you can run this group of reports at any time.