Use this sample study type with Generative Design in Revit to generate alternatives for the placement of desks in a large room (organized in rows), such as an office space or a classroom.
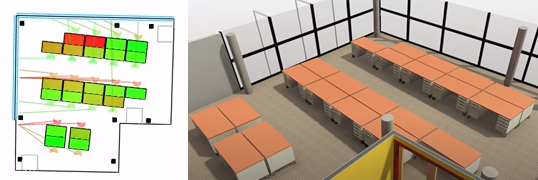
The left image shows an outcome in Generative Design. The right image shows the outcome when it's integrated into the Revit model.
In this topic
- Goals
- Accessing the study type
- Preparing the model
- Inputs
- Outputs
- Geometry visualization
- Known issues and limitations
Goals
When creating a study using the Optimize method, you can choose from the following goals:
- Maximize the number of desks in the room. (desk count)
- Maximize the average score for the quality of views to outside from each desk. (views to outside)
- Minimize the average distance to exits.
Views to outside
This metric attempts to measure the quality of views to outside from the desks where they are placed. It calculates and averages the view scores across all desks by assigning relative values to each desk. Desks with no view get a value of zero. The desk with the best view is set as 1, with the remaining values falling between this range.
The view metric for a single desk is calculated as the distance to the nearest view target (a point that falls on a window or curtain wall element) from the desk's seat location point. A view target is only considered to be within range if it falls within a minimum distance from the seat (20 feet or 6 meters), and is within the defined view cone. The view cone is a 110 degree arc centered on the desk user's facing direction. This filter prevents windows that are behind a desk from being counted as within view for each desk.
Average distance to exits
The study calculates the shortest path routes from each desk to each door in the room. If the room has multiple doors, it chooses the shortest path for each desk. It then adds the length of all paths (one per desk) and divides by the number of paths.
Accessing the study type
In the Create Study dialog, the study type is available from the Autodesk Samples folder.
To open the study type in Dynamo, navigate to this folder:
- %PROGRAMDATA%\Autodesk\AECGD\Revit\Samples <release>\<language-locale>
If you can't find the study type in that location, you can download it using the following link. The ZIP file contains the DYN file and its Dependencies folder. Unzip (extract) its contents to a folder on your computer.
Preparing the model
To create a study of this type, the Revit model must contain the following:
- A room for the workspace layouts. The room should include at least one door, as well as windows or curtain walls adjacent to the room element. The room can also include columns, which are treated as obstacles during desk placement. It doesn't matter whether the columns are hidden in the model; they will still be treated as obstacles.
- A desk instance of the desired family type. The desk does not need to reside in the target room. If the desk is in the target room, it is moved in the resulting design alternatives.
Before creating a study of this type, do the following:
- Open the
Revit model.
If desired, you can download and use rac_advanced_sample_project.rvt with this study type.
- Open a view to display the target room.
During the process of creating the study, you'll select the target room and the desk instance.
For example, in rac_advanced_sample_project.rvt, open the 03 - Floor plan, and zoom into the room in the upper left corner, Open Office 321.
- To make it easier to select the room, turn on visibility for rooms in the view.
- Also turn on visibility for furniture in the view.
- Add a desk to the room (or near the room).
For example, in rac_advanced_sample_project.rvt, in Open Office 321, add a student desk.
Inputs
When creating a study, you can specify the following inputs.
- Select a desk family instance: In the Revit model, select an instance of the desk type that you would like the graph to use as a reference for the width and depth of the desks drawn in the study. When the study completes, this desk type is used when placing elements.
- Select a room: In the Revit model, select the target room. See Preparing the model for more details.
- Desk row rotation: The angle in degrees that the graph rotates each desk row. Values are between -90 and 90 degrees. Zero degrees means that the desk rows are parallel with the longest wall in the room. When using the Like This method, you can use a number slider to specify a starting value. With other methods, clear the check box to specify a constant value.
- Spacing between rows (ft.): The distance (in feet) to offset the centerline of each row. Values are between 10 and 16 feet. This input allows desks to adapt to obstructions like columns. When using the Like This method, you can use a number slider to specify a starting value. With other methods, clear the check box to specify a constant value.
Outputs
When exploring outcomes of a study, the following outputs are displayed:
- Desk count
- Views to outside
- Average distance to exits
See Goals for more details.
Geometry visualization
The following is a sample workspace layout.
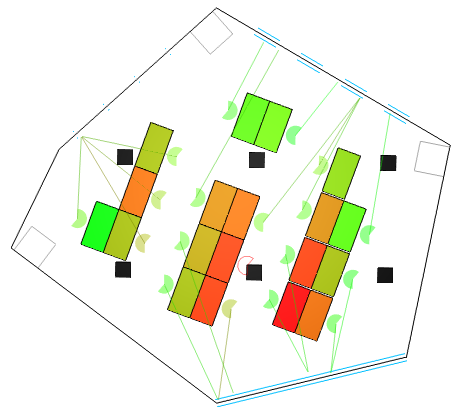
Room geometry
- Solid black lines are the wall centerlines of the room's core boundary.
- Double blue lines represent windows or curtain walls that provide views.
- Black filled rectangles are column obstruction zones.
- Gray rectangles are door obstruction zones.
Desk colors
- The desk colors indicate how close (green) or far (red) each desk is from the nearest exit.
- Scale: Red (worst) to green (best). The number scale is relative to each outcome generated.
Views to outside
- The shape of each desk seat cone represents the facing direction of that seat, and the area that views from the seat are considered.
- Scale: Red (worst) to green (best). The number scale is relative to each outcome generated.
- The color of each desk seat cone and the line attached to it is determined by the relative score of that desk's view.
Known issues and limitations
- This study type was tested using the US Imperial desk families included with Revit. The origin point is the front left corner of the desk, with the desk front facing in the negative Y direction. If desk elements created by Generative Design are aligned differently than the preview image shown in the application, edit the selected desk family to use the same placement point and orientation as those Revit desk families. Alternatively, you can edit the Dynamo graph for this study, and update the nodes defined in the "Place Desks in Revit" section of the graph to work with your desired family type.
- Deleting the referenced desk during study setup results in element creation failing for study outcomes.
- If the selected room has no doors, the Average Distance to Exits metric and the corresponding desk colors fail. Desks are still generated.
- If the selected room has no windows (but all other expected elements), the Views to Outside metric and associated geometry display fails. Desks are still generated.
- Desks can be placed on top of columns if the column's perimeter curve falls completely within the desk's perimeter curve.
If you encounter this issue, after integrating an outcome to create the desks in the Revit model, manually delete the desks that collide with columns.