Use this procedure to add columns for each property to be reported in schedule tables created from a schedule table style.
Each column contains the values for one property in a property set. The property set definitions for the properties you specify must exist in the drawing before you can create columns for them.
You must also specify the objects that the schedule table style applies to before you add columns.
- Click
 .
. 
The Style Manager is displayed with the current drawing expanded in the tree view.
- Expand Documentation Objects, and expand Schedule Table Styles.
- Select the schedule table style that you want to change.
- Click the Columns tab.
- Click Add Column to add a column to the right of the last column.
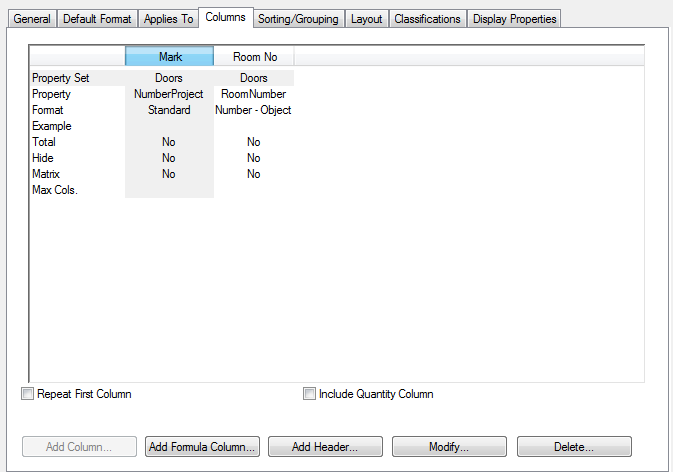
The Add Column worksheet opens.
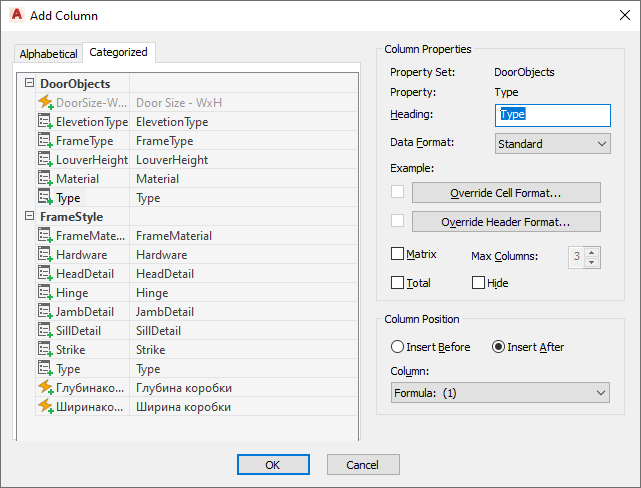
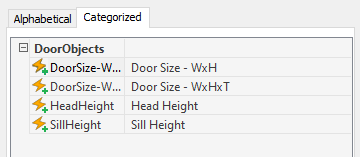
- Select the property to track for the new column from the pane on the left.
Properties that have already been designated for another column are unavailable in the properties list.
- Enter the heading for the column.
The property description is the default text for the column header.
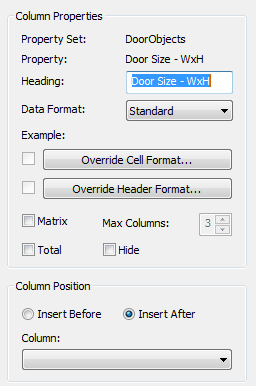
- Select the property data format, or use the default format from the property set definition.
The data format selected here takes precedence if it does not match the format specified in the property set definition for this property, and any formatted value stored in the property set definition is converted to display in the data format selected for this column.
- Specify additional settings for the column:
If you want to… Then… specify a format and orientation for cells in this column click Override Cell Format, and specify format settings that apply only to data cells in this column. specify a format and orientation for the column heading click Override Header Format, and specify format settings that apply only to data cells in this column. use a matrix format for the values in the column select Matrix, and enter the maximum number of columns used to report the values for the selected property. report a total value from all the values in this column select Total. hide the column from view in the drawing select Hide. When you edit property data to be displayed in a matrix column, you can assign multiple values by using a text data type and separating the values with semicolons. Each value is displayed in a separate column in the matrix column.
- Specify the placement of the new column relative to existing columns.
You can change the location of a column by dragging it to a new location in the schedule table.
- Click OK twice.