Adding Forecast Rainfall
In the preceding step, the rainfall entering the system comes from rain gauges. We are now going to add radar rainfall. If there is only forecast radar rainfall available, the user could use rain gauge data in the hindcast period (period before the run origin) and radar rainfall in the forecast period (period after the run origin). The observed and forecast spatial radar data must be stored within different spatial time series data objects, due to the different format of the data.
- Create a new spatial time series data object by right-clicking the Model Group icon in the Explorer window, and selecting New InfoWorks | Spatial time series database. Call the new object Forecast Spatial TSDB.
- Open the spatial time series database by dragging it onto the main window.
- The
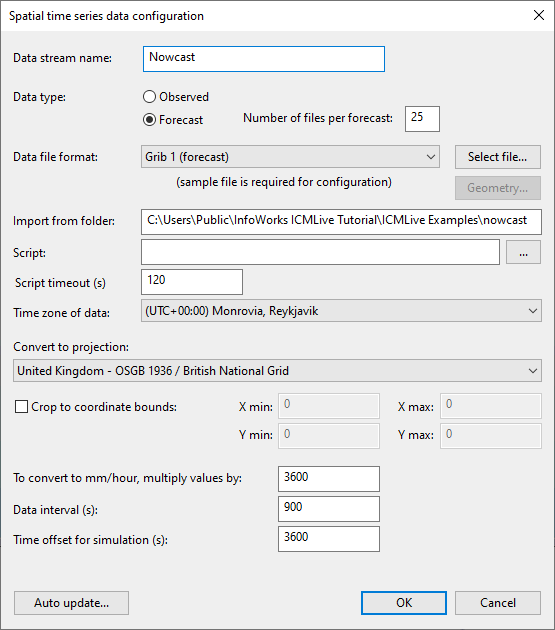
Spatial Time Series Data configuration dialog is displayed:
- Type in Nowcast as the data stream name.
- Select Forecast as the data type and set the Number of files per forecast to 25.
- Set the data file format to Grib 1 (forecast).
- Click the Select file button to browse to the nowcast folder in the training data location. Select one of the grib files on the standard Windows Open dialog that gets displayed, and select Open. The path to the nowcast folder automatically populates the Import from folder box.
- Ensure that the correct time zone is selected (UTC Dublin), as shown in the screenshot below.
- Select the United Kingdom - OSGB 1936 / British National Grid projection.
- Disable the option to crop to coordinate bounds. The values in these fields are set automatically to the GeoPlan Window that is open (if any). In our case the dataset is small but if you have a large radar file then it is a good idea to make sure that the data is cropped, otherwise a large amount of data will be imported and stored unnecessarily.
- Set the conversion to mm/hr to
3600, the data interval to
900s and the time offset for simulation to
-900s.
 Tip: It is a good idea to spend time ensuring that you have the correct data in this dialog as certain fields cannot be edited once the OK button has been pressed.
 - Click OK.
- The
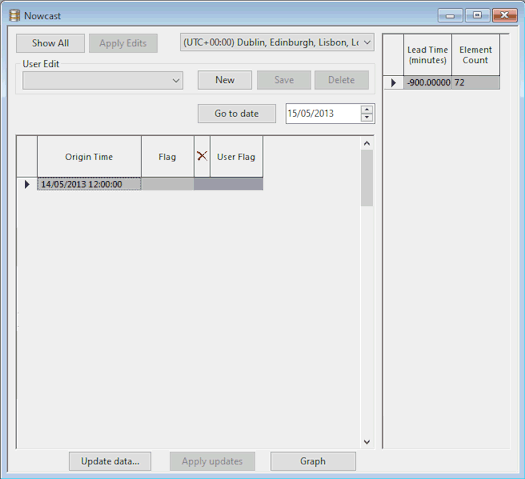
Time Series Data grid is displayed for the spatial time series data object. It can be seen in the newly created spatial time series database that only one data entry is shown to have been imported. This is because the previous task was simply to map the connection between the
ICMLive model and the external data source. Once operating as a live system, this data will be automatically harvested and placed within the spatial time series database (in the same way the other TSDs will be populated).
- To load all data currently stored in the training folder:
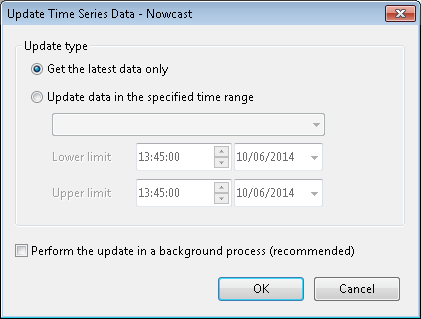
- Click the Update data button. The Update Times Series Data dialog is displayed.
- Enable the Get the latest data only option
- Disable the
Perform the update in a background process (recommended) option.
Tip: We have disabled this option for the purpose of this tutorial but it is highly recommended to leave it enabled for real life spatial time series data objects as updates may be very time-consuming and implementing them in the foreground may prevent users from carrying out other tasks on the computer.
- Click OK.
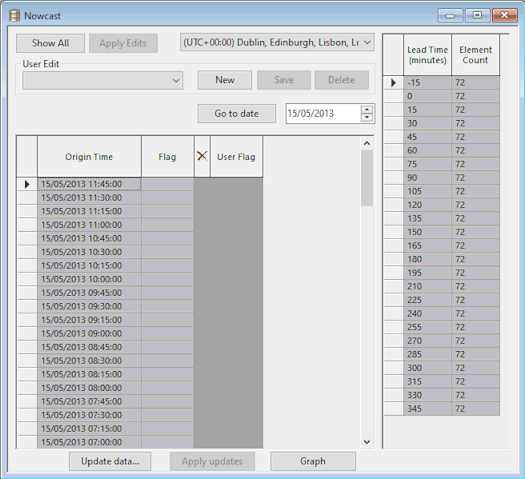
- This may take some time, as for this forecast data there are 25 files per forecast, which need to be read and imported. Once the process has finished then there should be 96 entries in the left hand table, and for each of these entries, there will be 25 entries on the right table
To see what information has been used in the mapping process, right-click the spatial time series data object in the Explorer window and select Open As then Data source configuration. Close the time series data grid.
Adding Observed Rainfall
- Create a new spatial time series data object and call the new object Observed Spatial TSDB.
- Open the spatial time series database by dragging it onto the main window.
- The
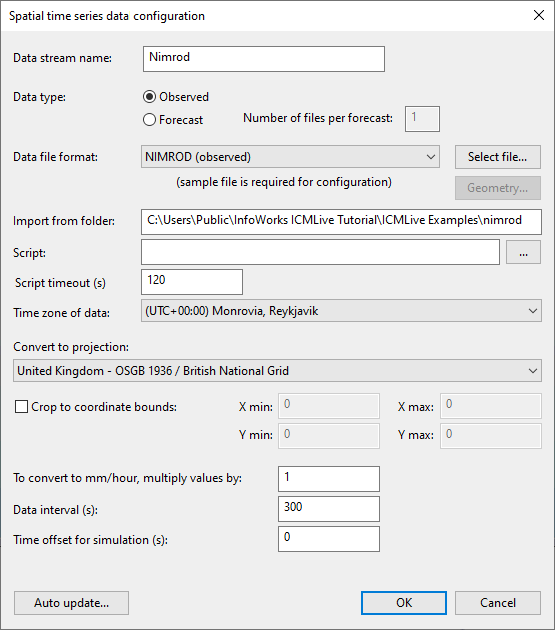
Spatial Time Series Data configuration dialog is displayed:
- Type in Nimrod as the data stream name.
- Select Observed as the data type.
- Set the data file format to NIMROD (observed).
- Click the Select file button to browse to the nimrod folder in the training data location. Select one of the nimrod files on the standard Windows Open dialog that gets displayed, and select Open. The path to the nimrod folder automatically populates the Import from folder box.
- Ensure that the time zone and projection are the same as for the Forecast Spatial TSDB object generated above.
- Uncheck the option to crop to coordinate bounds. The values in these fields are set automatically to the GeoPlan Window that is open (if any). In our case the dataset is small but if you have a large radar file then it is a good idea to make sure that the data is cropped, otherwise a large amount of data will be imported and stored unnecessarily.
- Set the conversion to mm/hr to
1, the data interval to
300s and the time offset for simulation to
0s.
- Click OK.
Tip: It is a good idea to spend time ensuring that you have the correct data in this dialog as certain fields cannot be edited once you click OK. - The
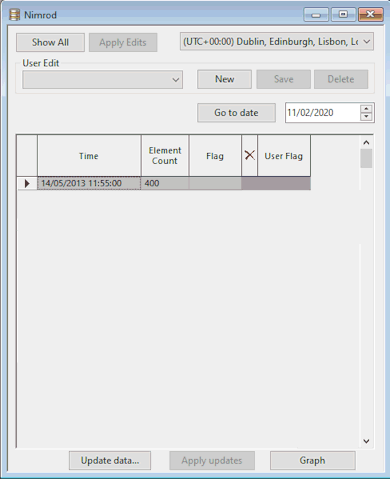
Time Series Data grid is displayed for the spatial time series database. It can be seen in the newly created spatial time series database that only one data entry is shown to have been imported.
- As for the forecasted data, use the functionality provided by the
Update data button to bring in the remainder of the Nimrod data:
- Click the Update data button.
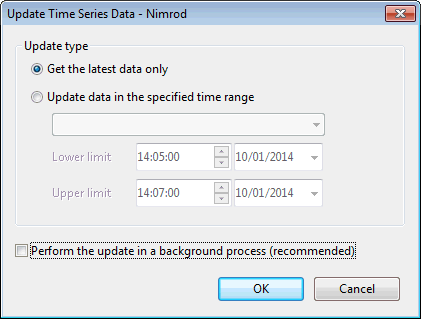
- The Update Times Series Data dialog is displayed.
- Enable the Get the latest data only option.
- Disable the
Perform the update in a background process (recommended) option.
Tip: We have disabled this option for the purpose of this tutorial but it is highly recommended to leave it enabled for real life spatial time series databases as updates may be very time-consuming and implementing them in the foreground may prevent users from carrying out other tasks on the computer.
- Click OK.
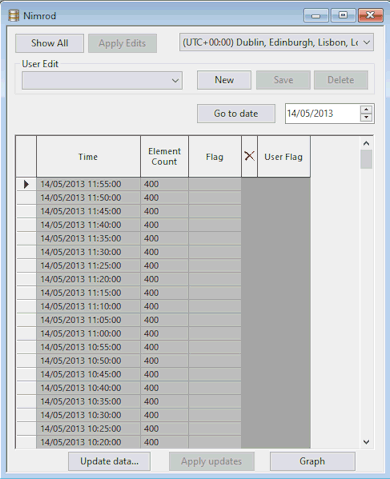
- The grid is updated with the data:
- Close the time series data grid.
Now that the spatial data has been set up, links to the network need to be implemented.
Network Connections to Radar Data
Scalar rainfall data was connected to the network by means of TVD connectors. Radar data is connected, most simply, by means of a spatial rain zone. This is a polygon which defines the area over which the radar rainfall can be applied:
- Open the
Tutorial network - step 3 completed network in the GeoPlan Window. Add a GIS layer to the network on the GeoPlan (please click on this
link for instructions on how to create a layer list). On the GeoPlan window, draw a polygon which encapsulates the full network (including the subcatchments):
- Set the
Object Type dropdown to
Polygon and click the
Create New Object button (
 ).
).
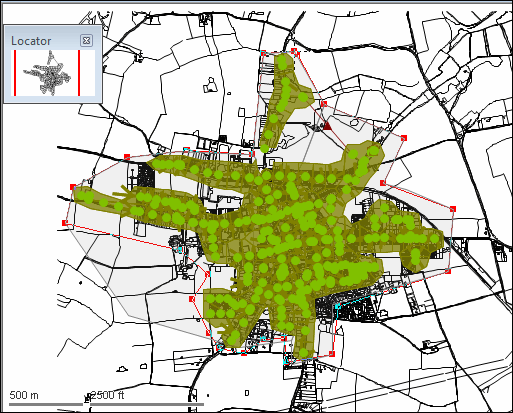
- Digitise a polygon as shown below:
- Once digitisation is completed, the
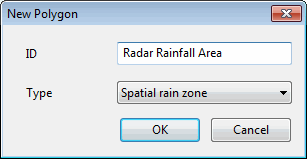
New Polygon dialog is displayed. Enter
Radar Rainfall Area in the ID box and select
Spatial Rain Zone in the
Type dropdown.
- Click OK.
- Set the
Object Type dropdown to
Polygon and click the
Create New Object button (
- The Object Properties Window is displayed for the spatial rain zone. No other information is required for the spatial rain zone; its entire remit is to define the area over which radar rainfall can be applied.
- Which rain source is used and when, however, does need be set. Simulations can be carried out without specifically defining this, but the data used will be based on the order in which the Time Series Data objects appear in the
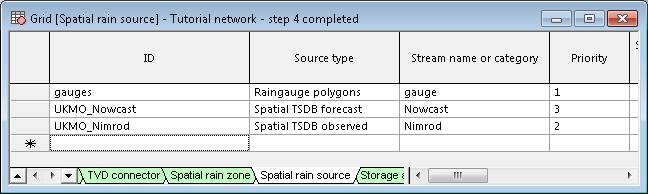
Schedule Hydraulic Run View, only using the lower priority data when the data in the higher priority objects is missing. It is much safer to specify the how the data is used in the Spatial Rain Source grid:
- Open the Polygons Window by selecting
New polygons window from the
 button of the
Windows toolbar.
button of the
Windows toolbar.
- Select the Spatial Rain Source tab.
- Create a new entry called UKMO_Nowcast. Select the appropriate source type (Spatial TSDB forecast) using the Source type dropdown list and then type in the stream name or category (Nowcast) that was specified at configuration time. Set the priority to be 3.
- Create a new entry called
UKMO_Nimrod. Select the appropriate source type (Spatial TSDB observed) using the
Source type dropdown list and then type in the stream name or category (Nimrod) that was specified at configuration time. Set the priority to be
2.
- Close the New polygons window.
For this tutorial, we are going to use rain gauge and observed radar data during the hindcast period and forecast radar rainfall during the forecast period. Where data sources overlap we can use the Priority field to determine which sources get used ahead of others.
- Open the Polygons Window by selecting
New polygons window from the
- Validate and commit the network changes.
- Open the
Schedule Hydraulic Run View for the run that used the scalar TSD (Test TSDB - with rain gauges):
- Rename the run Test TSDB - with rain gauges, Nowcast and Nimrod RADAR data.
- Update the network to latest. If using the provided network, use Tutorial network - step 4 completed.
- Drag the Spatial TSDB observed and Spatial TSDB forecast objects from the Explorer window onto the TSD / Spatial TSD box.
- Ensure that the Start date and time is 12:00 13/05/2013.
- Change the simulation duration to 48 hours.
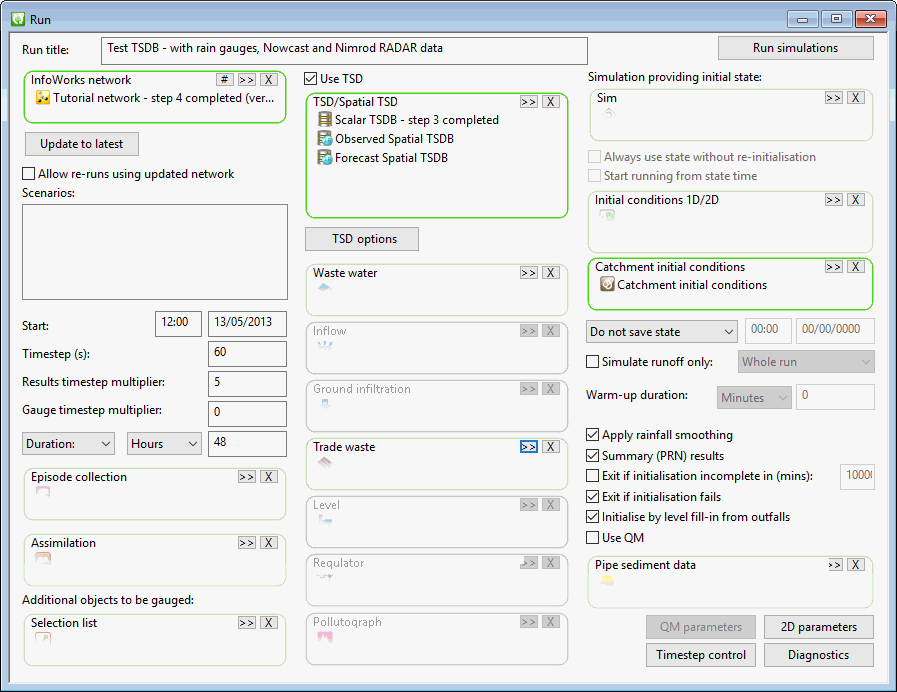
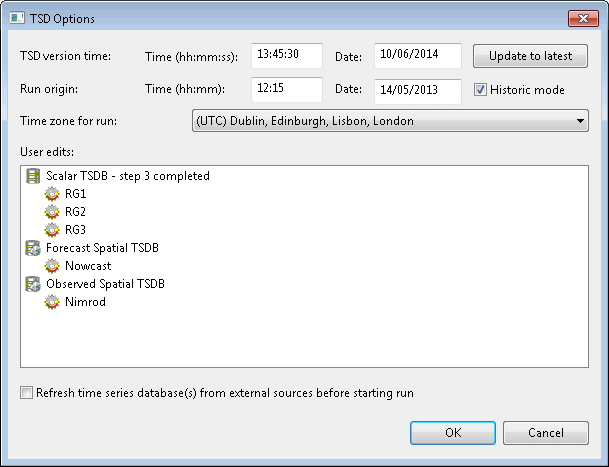
- Remember to update the TSD to use the latest and ensure that the run origin is set to 12:15, 14/05/2013 and
Historic mode is checked. For this, click the
TSD options button and implement the changes as appropriate in the
TSD Options dialog that gets displayed. Click
OK to close the dialog.
- Run the simulation by clicking on the Run simulations button of the Schedule Hydraulic Run View.
We are now going to configure a rainfall theme so that RADAR rainfall can be seen on the GeoPlan whenever replaying the simulation.