Activity 5: Solve the analysis and view the results
In this activity, you run the analysis and examine the safety factor, stress, displacement, heat flux, and thermal gradient results. You use the results to
Determine whether the brake rotor will yield as a result of the loads you applied
Identify the areas of maximum stress
Look at different color transition options on the result
Explain the location of the maximum stress
Explain the temperature distribution
Animate the displacement result to see how the rotor changes with use.
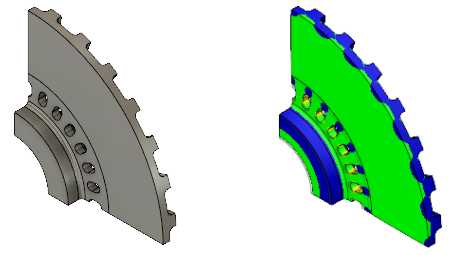
Brake rotor ready for analysis (left). Brake rotor model showing safety factor results (right).
Prerequisites
- Activity 4 is complete.
Steps
Solve the study.
- Click
 (Simulation workspace > Setup tab > Solve panel > Solve), to open the Solve dialog.
 - Click Solve to start the analysis and close the Solve dialog.
- When the analysis is complete, click Close to close the Job Status dialog.
The Results tab opens automatically, so you can view the results.
- Click
Determine whether the rotor will yield as a result of the applied structural and thermal loads.
- Examine the Safety Factor result, which is displayed initially.
The Min/Max result probes are visible by default. If you wish to hide them, in the click
 (Simulation workspace > Results tab > Inspect panel > Hide Min/Max).
 - Notice that the safety factor is greater than 2.0, which indicates that the rotor will not yield as a result of the applied structural and thermal loads.
- Notice that the lowest safety factors occur near the edges of the air slots provided for cooling the rotor interior.
To get a better understanding of why the safety factor is lowest around the edges of the notches you'll take a look at the stress, temperature distribution, and heat flux results.
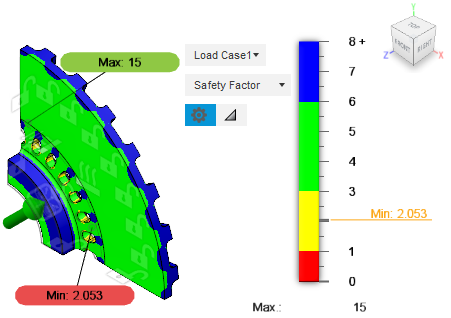
- Examine the Safety Factor result, which is displayed initially.
Identify where the maximum stress occurs.
- Select the Stress result from the result drop-down menu, near the legend. The von Mises stress contours are displayed.
- Notice that the maximum stress results occur in the same places that the minimum safety factors occur, with radial bands of increased stress along the friction face.
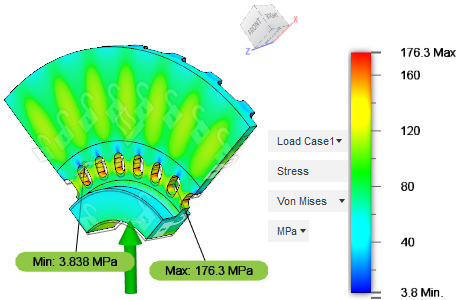
Identify where the maximum heat flux occurs, and switch from a smooth color transition to banded.
- Select the Heat Flux result from the result drop-down menu, near the legend.
- Click
 Legend Options, adjacent to the legend, to open the Legend Options dialog.
 - Change the Color Transition to Banded. Notice that it's easier to see the bands of highest heat flux.
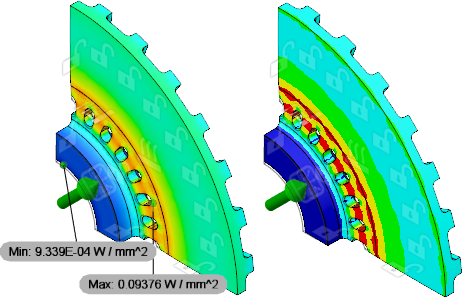
The area of maximum heat flux corresponds to the area of maximum stress and minimum safety factor. The air slots cause the heat flowing from the heat source to the water-cooled shaft to concentrate in a reduced cross-section of the cast iron material.
Use the thermal gradient result to explain the locations of maximum stress in step 3. Steeper thermal gradients produce greater stresses because of the significant variation in thermal expansion in a small area.
- Select the Thermal Gradient result from the result drop-down menu, near the legend.
- Notice that the highest thermal gradients occur in the regions of the air slots. The maximum thermal gradient here is just under 2° C per mm of linear distance.
- Notice that the heat flux and thermal gradient color contours are essentially identical, though the units and magnitudes differ. This difference is more apparent using the Banded color transition than the Smooth.
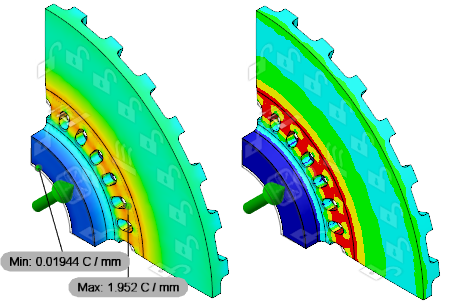
In addition to the thermal gradient, changes in the material cross section affect both structural and thermal stresses. A given thermal gradient produces more thermal stress in a large cross section than the same gradient would in a smaller cross section. This phenomenon explains the radial bands of increased stress along the friction face seen in step 3. Each area of increased stress corresponds to a radial rib location on the opposite side of the disk. These observations fully explain the von Mises stress distribution observed in step 3. - Switch back to the Smooth color transition and click OK to close the dialog.
Switch to the Temperature result and try to explain the temperature distribution.
- Select the Temperature result from the result drop-down menu, near the legend.
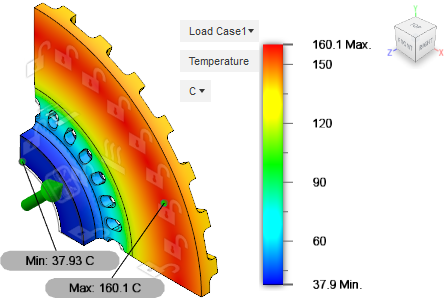
- Notice that the maximum temperature is at the pad contact face, which is where heat is generated by friction during braking, so this is expected.
- Notice that the temperature decreases quite rapidly as you move radially inward from the maximum temperature region.
Heat is being removed by a combination of convection (at all exposed faces) and conduction to the lower fixed temperature at the hub bore face. Moving radially inward, the convective and conductive heat flows are both directed away from the maximum temperature region and are additive.
- Notice that the temperature decreases as you move radially outward, but not as rapidly.
Moving radially outward, you are going opposite to the direction of conductive heat flow. Heat always flows from higher to lower temperatures. Therefore, the heat loss in the outermost region of the disk is purely convective. Without the conductive component, there is less rapid heat loss in this region.
- Select the Temperature result from the result drop-down menu, near the legend.
Animate the individual X, Y, and Z components of displacement results, using the Fastest speed, and the One-way option, to see the change in size of the rotor.
- Select the Displacement result from the result drop-down menu, near the legend.
Notice that the maximum displacement of the rotor is over 0.3 mm, and it occurs at the outside diameter edge of the heat source face.
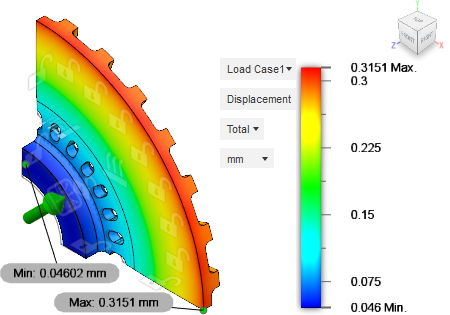
- From the component drop-down list next to the plot legend, switch from Total to X.
- Click
 (Simulation workspace > Results tab > Result Tools panel > Animate) to open the Animate dialog.
 - Activate the One-way option to see the growth.
- In the Speed drop-down list, choose Fastest.
- Click
 Play.
Play.
Notice that the displacement is predominantly radial growth. - With the animation still playing, switch to the Y component, and then the Z component.
- Click OK to close the Animate dialog, when you've seen enough.
- Select the Displacement result from the result drop-down menu, near the legend.
Activity 5 summary
In this activity, you ran the analysis and
- Determined that the brake rotor does not yield as a result of the loads you applied
- Identified the areas of maximum stress
- Looked at different color transition options on the result
- Explained the location of the maximum stress
- Explained the temperature distribution
- Animated the displacement result to see how the rotor changes with use.