Use compaction analysis to show how well your material will be applied to the surface.

This illustration of a compaction analysis shows areas where a roller would not be able to fit and maintain enough pressure (compaction) on the material to properly apply it to the surface. Red areas indicate no compaction, while yellow indicates a potential lack of compaction.
To adjust compaction analysis values:
- In the
TruPlan browser, double-click your compaction analysis.
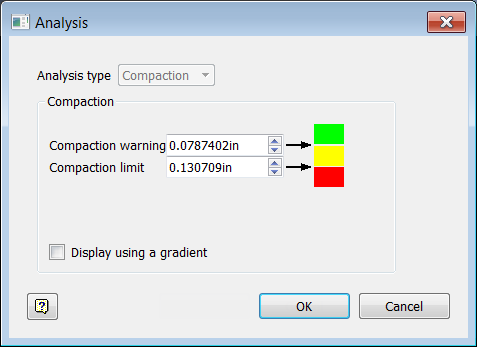
The Analysis dialog box opens.

- Optional: Click the color swatches to set highlight colors; from top to bottom, these colors are used to indicate compaction levels:
- Acceptable (green in this case)
- Risk of reduced compaction (yellow in this case)
- Not enough compaction (red in this case)
- Set compaction values.
A roller can compress so it can force material into difficult to reach spots. These are the levels of compression supported by the roller. The higher the value, the more compression allowed, and the more easily a roller can apply material to troublesome spots.
- Compaction Warning: Areas requiring this level of compression in the roller will be highlighted with the warning color (yellow).
- Compaction Limit: Areas requiring a higher level of compression than this will be highlighted with the limit color (red).
- Optional: Select
Display using a gradient.
If you select this, gradients are used depending on the value of the compaction at that specific location. For instance, if the value is greater than the Compaction Warning and less than the Compaction Limit, then the value is displayed as a gradient based on where the actual value is relative to those limits and their colors.
You can increase compaction values to reduce or eliminate problem spots provided your manufacturing solution supports the values. In the case of the preceding illustrations, with the Compaction Warning increased from 0.13 to 0.43, limit areas are eliminated.

Another way to improve compaction is to reduce the bandwidth of your course, such as by:
- Reducing the number of tows, or;
- Using a narrower material