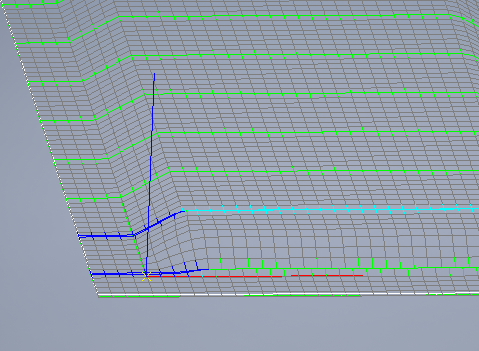
Use gap analysis to highlight areas of your mesh where gaps or overlaps between courses approach or exceed given values.

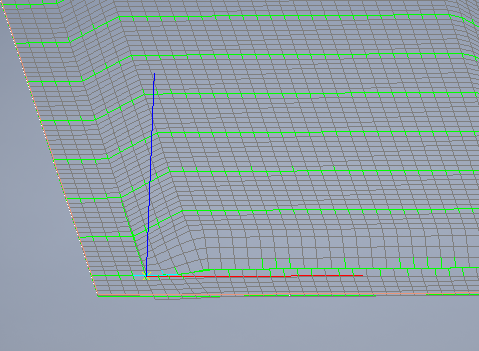
- Green lines on the ply indicating that the distance between courses is acceptable.
- Dark and light blue lines on the ply indicating that too much overlap is occurring between these courses.
Gap analyses might also have lines indicating gaps that are critically wide (yellow) or definitely too wide (red).
To adjust gap analysis values:
- In the
TruPlan browser, double-click your gap analysis.
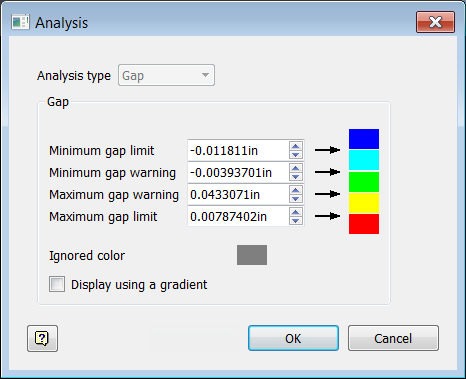
The Analysis dialog box opens.

- Optional: Click the color swatches to set highlight colors; from top to bottom, these colors are used to indicate gaps whose values are:
- Definitely too small (dark blue in this example); in some cases, this can correspond to negative numbers, indicating overlaps
- Critically small (light blue in this example); in some cases, this can correspond to negative numbers, indicating overlaps
- Acceptable (green in this example)
- Critically large (yellow in this example)
- Definitely too large (red in this example)
- Set gap parameters:
- Minimum Gap Limit: The smallest allowable gap; this can be set to a negative value to detect overlaps. Gaps that have a value lower than the Minimum Gap Limit are highlighted with the limit color (in this case, dark blue) and should be avoided.
- Minimum Gap Warning: Value below which a gap will be highlighted with the warning color (in this case, light blue). Like Minimum Gap Limit, this can be set to a negative value to detect overlaps.
- Maximum Gap Warning: Value above which the gap will be highlighted with the warning color (in this case, yellow). Gaps between this value and the Minimum Gap Warning are considered to be acceptable.
- Maximum Gap Limit: Value above which the gap will be highlighted with the limit color (in this case, red). Gaps above this size should be avoided.
- Optional: Select
Display using a gradient.
If you select this, gradients are used depending on the value of the gap at that specific location. For instance, if the value is greater than the Maximum Gap Warning and less than the Maximum Gap Limit, then the value is displayed as a gradient based on where the actual value is relative to those limits and their colors.
It is up to you to decide if your gaps are acceptable for manufacturing. In some cases, you might need to adjust the properties of your strategy to improve the alignment of your courses. For example, a gap analysis might determine that you have overlaps that will require tow cutting. In this case, you could change the propagation mode of your strategy to Constant Angle Offset to avoid these overlaps.

However, this could result in other less desirable effects, such as angle analysis warnings. You need to compare strategy properties and analyses in situations like these and decide what will work best for your manufacturing solution.