
Export Visual Data to CSV or Excel
You can export data from any type of chart or graph into the following formats:
- A text file containing comma-separated values (CSV), available for all visual types.
- A Microsoft Excel workbook file (.XSLX), available for pivot tables and table charts.
To export data from a visualization:
Click Dashboards from the left navigation in Insight Builder.
Click the visualization that you want to export. Make sure it's selected and highlighted.
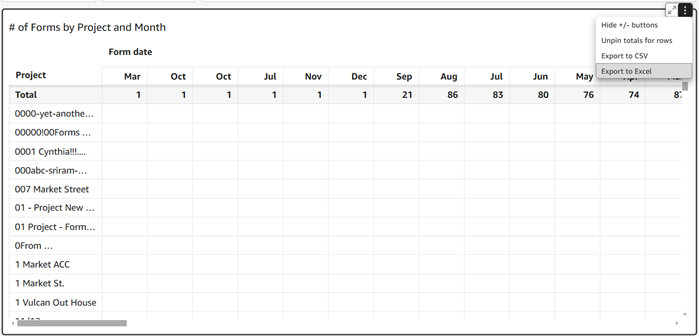
At the top right on the visual, open the menu and choose one the of the following options:
Export to CSV

or
Export to Excel
Depending on your browser settings, one of the following happens:
- The file automatically goes to your default Download location.
- A dialog box appears so you can choose a file name and location.
- A dialog box appears so you can choose to open the file with the default software or to save to.
Tip: Once the file has been generated, you can see the following message in the upper right corner of the page: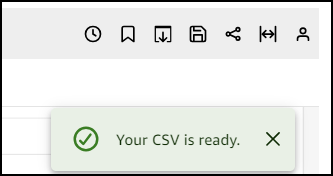
If needed, download the file locally.